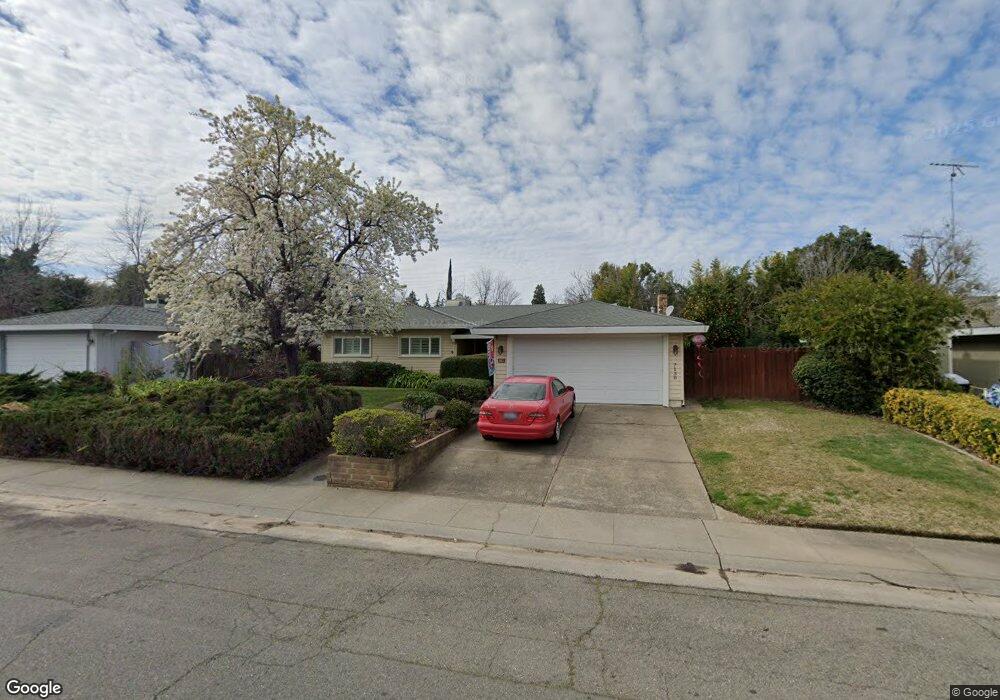
7130 Brookcrest Way Citrus Heights, CA 95621
Estimated Value: $503,231 - $549,000
3
Beds
2
Baths
1,547
Sq Ft
$335/Sq Ft
Est. Value
About This Home
This home is located at 7130 Brookcrest Way, Citrus Heights, CA 95621 and is currently estimated at $518,808, approximately $335 per square foot. 7130 Brookcrest Way is a home located in Sacramento County with nearby schools including Coyle Avenue Elementary School, Will Rogers Middle School, and San Juan High School.
Ownership History
Date
Name
Owned For
Owner Type
Purchase Details
Closed on
Aug 27, 2019
Sold by
Leone Anderson Antoinette
Bought by
Leone Anderson Antoinette and Leone Antoinette Anderson Rlt
Current Estimated Value
Purchase Details
Closed on
Mar 12, 2010
Sold by
Marschall Markus and Marschall Banjang
Bought by
Leone Anderson Antoinette
Home Financials for this Owner
Home Financials are based on the most recent Mortgage that was taken out on this home.
Original Mortgage
$105,000
Interest Rate
5%
Mortgage Type
New Conventional
Purchase Details
Closed on
Feb 25, 1994
Sold by
Choi Sin J and Choi Kung S
Bought by
Marschall Markus and Marschall Banjang
Home Financials for this Owner
Home Financials are based on the most recent Mortgage that was taken out on this home.
Original Mortgage
$136,320
Interest Rate
7.09%
Mortgage Type
FHA
Create a Home Valuation Report for This Property
The Home Valuation Report is an in-depth analysis detailing your home's value as well as a comparison with similar homes in the area
Home Values in the Area
Average Home Value in this Area
Purchase History
| Date | Buyer | Sale Price | Title Company |
|---|---|---|---|
| Leone Anderson Antoinette | -- | None Available | |
| Leone Anderson Antoinette | $205,000 | Placer Title Company | |
| Marschall Markus | $137,500 | Chicago Title Company |
Source: Public Records
Mortgage History
| Date | Status | Borrower | Loan Amount |
|---|---|---|---|
| Closed | Leone Anderson Antoinette | $105,000 | |
| Previous Owner | Marschall Markus | $136,320 |
Source: Public Records
Tax History Compared to Growth
Tax History
| Year | Tax Paid | Tax Assessment Tax Assessment Total Assessment is a certain percentage of the fair market value that is determined by local assessors to be the total taxable value of land and additions on the property. | Land | Improvement |
|---|---|---|---|---|
| 2025 | $3,125 | $264,602 | $90,349 | $174,253 |
| 2024 | $3,125 | $259,415 | $88,578 | $170,837 |
| 2023 | $3,046 | $254,330 | $86,842 | $167,488 |
| 2022 | $3,030 | $249,344 | $85,140 | $164,204 |
| 2021 | $2,980 | $244,456 | $83,471 | $160,985 |
| 2020 | $2,924 | $241,951 | $82,616 | $159,335 |
| 2019 | $2,781 | $237,208 | $80,997 | $156,211 |
| 2018 | $2,748 | $232,558 | $79,409 | $153,149 |
| 2017 | $2,719 | $227,999 | $77,852 | $150,147 |
| 2016 | $2,538 | $223,529 | $76,326 | $147,203 |
| 2015 | $2,494 | $220,172 | $75,180 | $144,992 |
| 2014 | $2,440 | $215,860 | $73,708 | $142,152 |
Source: Public Records
Map
Nearby Homes
- 6071 Peoria Dr
- 6070 Peoria Dr
- 5861 Sperry Dr
- 5829 San Juan Ave Unit 5
- 5829 San Juan Ave Unit 39
- 6164 Peoria Dr
- 6801 Dunmore Ave
- 5813 Northgrove Way
- 5645 San Juan Ave
- 6940 Burnham Dr
- 6936 Burnham Dr
- 5664 San Juan Ave
- 7032 San Altos Cir
- 6901 Le Havre Way
- 5540 Willow Oak Way
- 7230 Linda Sue Way
- 5718 Southgrove Dr
- 6405 El Porto Ln
- 7004 Laurel Oak Way
- 6665 Greenback Ln
- 7136 Brookcrest Way
- 7124 Brookcrest Way
- 5824 Keyntel St
- 5828 Keyntel St
- 7110 Mary Ann Way
- 5820 Keyntel St
- 7142 Brookcrest Way
- 5832 Keyntel St
- 7118 Brookcrest Way
- 5816 Keyntel St
- 7109 Mary Ann Way
- 7141 Brookcrest Way
- 5836 Keyntel St
- 7148 Brookcrest Way
- 7100 Brookcrest Way
- 5812 Keyntel St
- 7147 Brookcrest Way
- 7113 Mary Ann Way
- 5821 Keyntel St
- 5829 Keyntel St