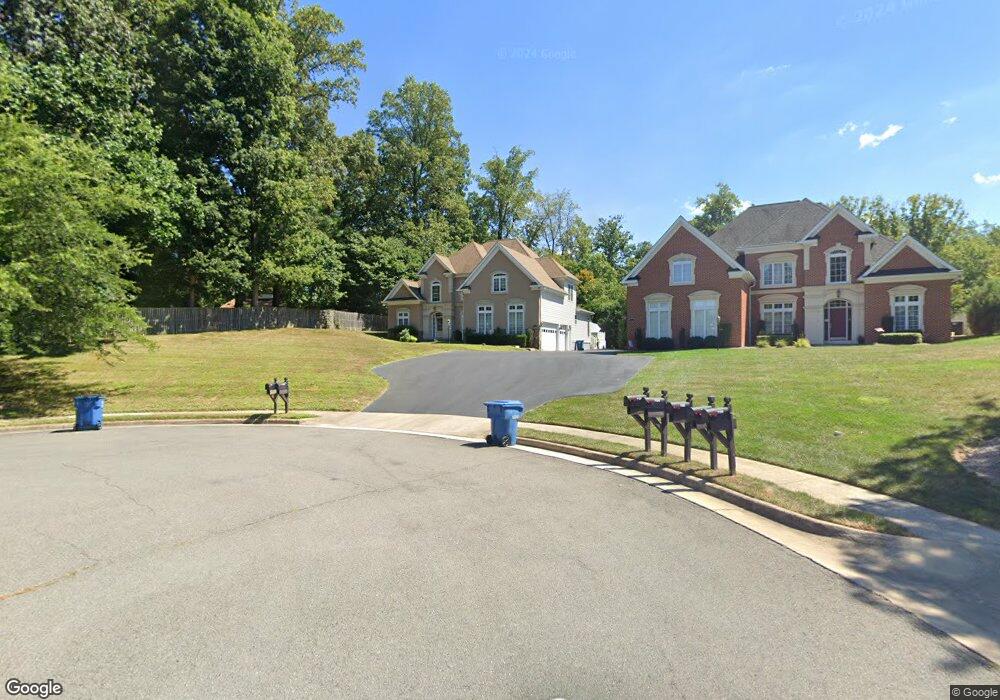
7131 Ayers Meadow Ln Springfield, VA 22150
Estimated Value: $1,204,608 - $1,263,000
5
Beds
5
Baths
3,579
Sq Ft
$345/Sq Ft
Est. Value
About This Home
This home is located at 7131 Ayers Meadow Ln, Springfield, VA 22150 and is currently estimated at $1,236,402, approximately $345 per square foot. 7131 Ayers Meadow Ln is a home located in Fairfax County with nearby schools including Forestdale Elementary School, Key Middle, and Lewis High School.
Ownership History
Date
Name
Owned For
Owner Type
Purchase Details
Closed on
Jun 23, 2009
Sold by
The Freedom Bank Of Virgi
Bought by
Phuong Kevin T
Current Estimated Value
Home Financials for this Owner
Home Financials are based on the most recent Mortgage that was taken out on this home.
Original Mortgage
$470,000
Outstanding Balance
$299,347
Interest Rate
4.92%
Mortgage Type
New Conventional
Estimated Equity
$937,055
Purchase Details
Closed on
Nov 17, 2006
Sold by
Owens William F
Bought by
Botero Homes Gallery Inc
Home Financials for this Owner
Home Financials are based on the most recent Mortgage that was taken out on this home.
Original Mortgage
$875,000
Interest Rate
6.39%
Mortgage Type
Construction
Purchase Details
Closed on
Jun 14, 2005
Sold by
Beldon D Scott Trustee
Bought by
Ames William K
Create a Home Valuation Report for This Property
The Home Valuation Report is an in-depth analysis detailing your home's value as well as a comparison with similar homes in the area
Home Values in the Area
Average Home Value in this Area
Purchase History
| Date | Buyer | Sale Price | Title Company |
|---|---|---|---|
| Phuong Kevin T | $750,000 | -- | |
| Botero Homes Gallery Inc | $337,500 | -- | |
| Ames William K | $150,000 | -- | |
| Owens William F | $150,000 | -- |
Source: Public Records
Mortgage History
| Date | Status | Borrower | Loan Amount |
|---|---|---|---|
| Open | Phuong Kevin T | $470,000 | |
| Previous Owner | Botero Homes Gallery Inc | $875,000 |
Source: Public Records
Tax History
| Year | Tax Paid | Tax Assessment Tax Assessment Total Assessment is a certain percentage of the fair market value that is determined by local assessors to be the total taxable value of land and additions on the property. | Land | Improvement |
|---|---|---|---|---|
| 2025 | $13,114 | $1,199,820 | $383,000 | $816,820 |
| 2024 | $13,114 | $1,131,960 | $358,000 | $773,960 |
| 2023 | $12,506 | $1,108,160 | $343,000 | $765,160 |
| 2022 | $10,824 | $946,600 | $298,000 | $648,600 |
| 2021 | $10,757 | $916,700 | $277,000 | $639,700 |
| 2020 | $10,369 | $876,100 | $261,000 | $615,100 |
| 2019 | $10,261 | $867,010 | $258,000 | $609,010 |
| 2018 | $10,008 | $870,290 | $258,000 | $612,290 |
| 2017 | $10,104 | $870,290 | $258,000 | $612,290 |
| 2016 | $10,443 | $901,430 | $258,000 | $643,430 |
Source: Public Records
Map
Nearby Homes
- 7401 Loughboro Ln
- 7358 Bloomington Ct
- 7820 Rose Garden Ln
- 7800 Solomon Seal Dr
- 7219 Beverly Park Dr
- 7204 Lavender Ln
- 7871 Rolling Woods Ct Unit 1104
- 6917 Villa Del Rey Ct
- 7779 Tiverton Dr
- 7239 Jillspring Ct Unit 17C
- 7213 Calamo St
- 7745 Tiverton Dr
- 6502 Milva Ln
- 6701 Bracken Ct
- 6916 Ruskin St
- 7200 Duck Ct
- 6824 Constance Dr
- 7039 Calamo St
- 8118 Viola St
- 7504 Mullingar Ct
- 7133 Ayers Meadow Ln
- 7210 Lackawanna Dr
- 7200 Lackawanna Dr
- 7129 Ayers Meadow Ln
- 7128 Ayers Meadow Ln
- 7125 Ayers Meadow Ln
- 7218 Lackawanna Dr
- 7611 Mcweadon Ln
- 7130 Ayers Meadow Ln
- 7122 Lackawanna Dr
- 7201 Lackawanna Dr
- 7613 Mcweadon Ln
- 7132 Ayers Meadow Ln
- 7122 Ayers Meadow Ln
- 7609 Mcweadon Ln
- 7209 Lackawanna Dr
- 7607 Mcweadon Ln
- 7120 Ayers Meadow Ln
- 7134 Ayers Meadow Ln
- 7117 Ayers Meadow Ln
Your Personal Tour Guide
Ask me questions while you tour the home.