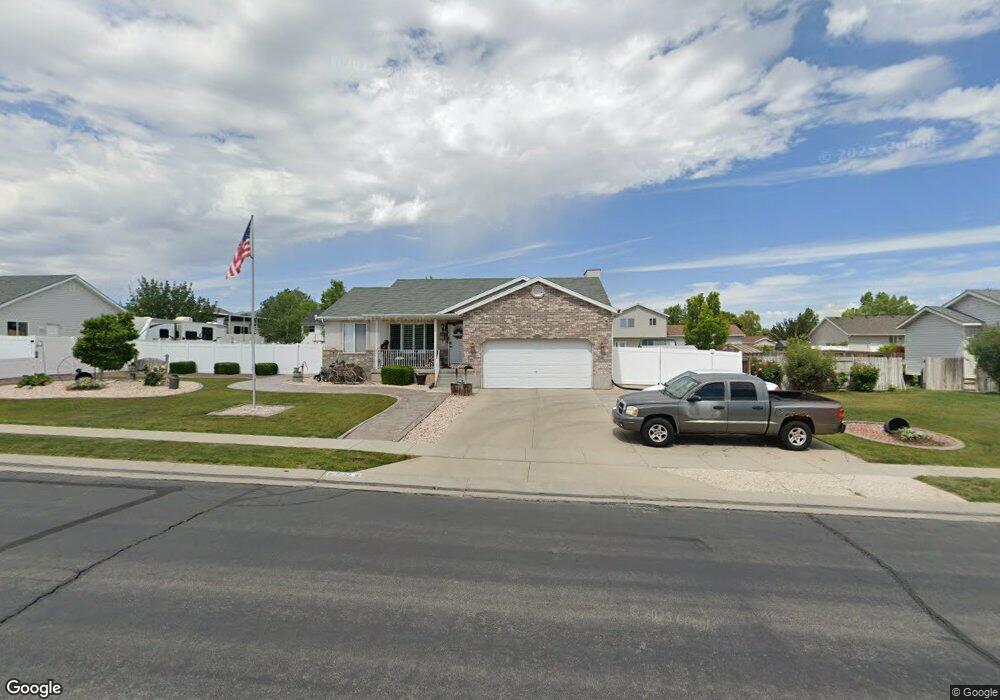
7132 Breeze Hill Rd West Jordan, UT 84081
Shadow Mountain NeighborhoodEstimated Value: $540,000 - $583,000
3
Beds
2
Baths
1,256
Sq Ft
$448/Sq Ft
Est. Value
About This Home
This home is located at 7132 Breeze Hill Rd, West Jordan, UT 84081 and is currently estimated at $562,433, approximately $447 per square foot. 7132 Breeze Hill Rd is a home located in Salt Lake County with nearby schools including Mountain Shadows School, West Hills Middle School, and Copper Hills High School.
Ownership History
Date
Name
Owned For
Owner Type
Purchase Details
Closed on
May 12, 2003
Sold by
Call Daniel C
Bought by
Call Daniel C and Call Leesa L
Current Estimated Value
Home Financials for this Owner
Home Financials are based on the most recent Mortgage that was taken out on this home.
Original Mortgage
$152,882
Outstanding Balance
$64,907
Interest Rate
5.71%
Mortgage Type
FHA
Estimated Equity
$497,526
Purchase Details
Closed on
May 8, 2003
Sold by
Call Daniel C and Call Leesa L
Bought by
Call Daniel C
Home Financials for this Owner
Home Financials are based on the most recent Mortgage that was taken out on this home.
Original Mortgage
$152,882
Outstanding Balance
$64,907
Interest Rate
5.71%
Mortgage Type
FHA
Estimated Equity
$497,526
Purchase Details
Closed on
Mar 30, 2000
Sold by
Call Daniel C
Bought by
Call Daniel C and Call Leesa L
Home Financials for this Owner
Home Financials are based on the most recent Mortgage that was taken out on this home.
Original Mortgage
$145,604
Interest Rate
8.38%
Mortgage Type
FHA
Create a Home Valuation Report for This Property
The Home Valuation Report is an in-depth analysis detailing your home's value as well as a comparison with similar homes in the area
Home Values in the Area
Average Home Value in this Area
Purchase History
| Date | Buyer | Sale Price | Title Company |
|---|---|---|---|
| Call Daniel C | -- | Preferred Title & Escrow Ins | |
| Call Daniel C | -- | Preferred Title & Escrow Ins | |
| Call Daniel C | -- | Merrill Title | |
| Call Daniel C | -- | Merrill Title | |
| Reliance Homes Inc | -- | Merrill Title |
Source: Public Records
Mortgage History
| Date | Status | Borrower | Loan Amount |
|---|---|---|---|
| Open | Call Daniel C | $152,882 | |
| Closed | Call Daniel C | $145,604 |
Source: Public Records
Tax History Compared to Growth
Tax History
| Year | Tax Paid | Tax Assessment Tax Assessment Total Assessment is a certain percentage of the fair market value that is determined by local assessors to be the total taxable value of land and additions on the property. | Land | Improvement |
|---|---|---|---|---|
| 2025 | $2,670 | $518,100 | $168,800 | $349,300 |
| 2024 | $2,670 | $513,800 | $162,300 | $351,500 |
| 2023 | $2,429 | $440,500 | $156,100 | $284,400 |
| 2022 | $2,510 | $447,800 | $153,000 | $294,800 |
| 2021 | $2,221 | $360,700 | $117,700 | $243,000 |
| 2020 | $2,101 | $320,200 | $108,300 | $211,900 |
| 2019 | $2,054 | $307,000 | $102,200 | $204,800 |
| 2018 | $1,886 | $279,500 | $102,200 | $177,300 |
| 2017 | $1,832 | $270,400 | $102,200 | $168,200 |
| 2016 | $1,645 | $228,100 | $107,300 | $120,800 |
| 2015 | $1,709 | $231,000 | $114,900 | $116,100 |
| 2014 | $1,666 | $221,800 | $111,200 | $110,600 |
Source: Public Records
Map
Nearby Homes
- 5151 Case Mountain Rd
- 6880 S Survey Peak Ln
- 6884 S Survey Peak Ln
- 6888 S Survey Peak Ln
- 7246 W Terraine Rd
- 7238 W Terraine Rd
- 7232 W Terraine Rd
- 5208 W Case Mountain Rd
- 6928 Beargrass Rd
- 7288 Comet Hill Cir
- 7563 S Opal Mountain Way W Unit 306
- 7567 S Opal Mountain Way W Unit 307
- 7556 S Opal Mountain Way W Unit 311
- 7569 S Opal Mountain Way W Unit 308
- 7554 S Opal Mountain Way W Unit 310
- 7553 S Opal Mountain Way W Unit 302
- 7173 S Kristilyn Ln
- 7071 S Kristilyn Ln
- 7138 S Brittany Town Dr
- 4888 Ticklegrass Rd
- 7148 Breeze Hill Rd
- 7127 Aerie Hill Dr
- 7127 S Aerie Hill Dr
- 7118 Breeze Hill Rd
- 7115 S Aerie Hill Dr
- 7115 Aerie Hill Dr
- 4992 Shayn Hill Dr
- 4992 W Shayn Hill Dr
- 7145 Aerie Hill Dr
- 7162 Breeze Hill Rd
- 7151 S Breeze Hill Rd
- 7151 Breeze Hill Rd
- 7099 S Aerie Hill Dr
- 7099 Aerie Hill Dr
- 7102 Breeze Hill Rd
- 7102 S Breeze Hill Rd
- 7113 Breeze Hill Rd
- 7165 Breeze Hill Rd
- 7165 S Breeze Hill Rd
- 7161 S Aerie Hill Dr