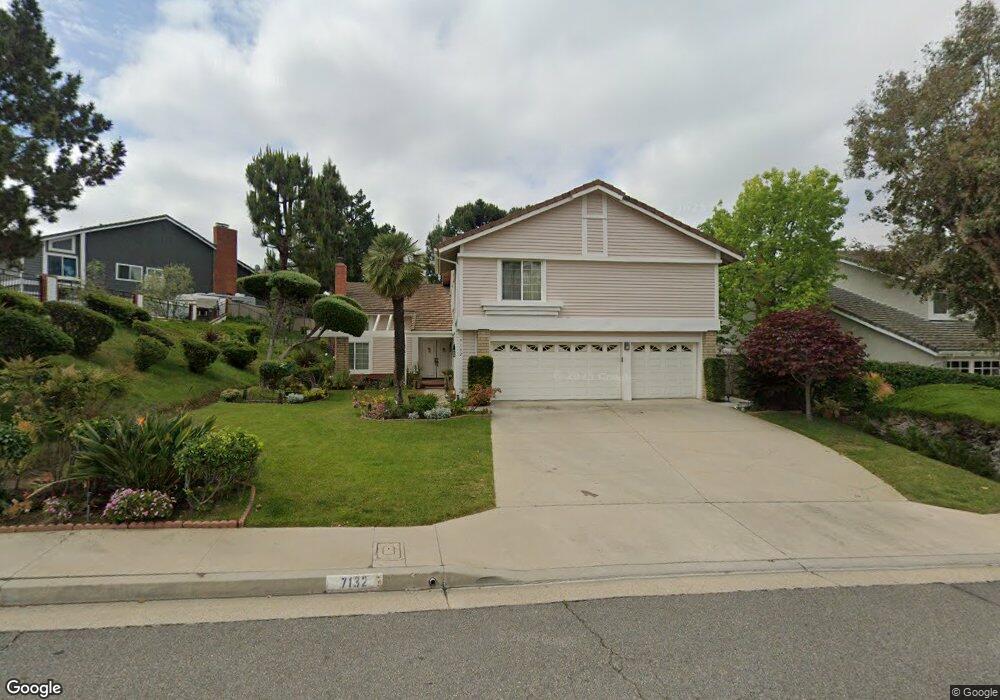
7132 E Mockingbird Way Anaheim, CA 92807
Anaheim Hills NeighborhoodEstimated Value: $1,662,000 - $1,777,000
4
Beds
3
Baths
3,217
Sq Ft
$528/Sq Ft
Est. Value
About This Home
This home is located at 7132 E Mockingbird Way, Anaheim, CA 92807 and is currently estimated at $1,697,271, approximately $527 per square foot. 7132 E Mockingbird Way is a home located in Orange County with nearby schools including Canyon Rim Elementary, Canyon High School, and El Rancho Charter.
Ownership History
Date
Name
Owned For
Owner Type
Purchase Details
Closed on
Aug 6, 2025
Sold by
Hsu Hai L and Hsu Chung
Bought by
Hsu Family Trust and Hsu
Current Estimated Value
Purchase Details
Closed on
Nov 24, 2010
Sold by
Hsu Chung and Hsu Hai Lun
Bought by
Hsu Chung and Hsu Hai Lun
Home Financials for this Owner
Home Financials are based on the most recent Mortgage that was taken out on this home.
Original Mortgage
$417,000
Interest Rate
3.37%
Mortgage Type
New Conventional
Purchase Details
Closed on
Sep 13, 1993
Sold by
Transamerica Financial Services
Bought by
Hsu Chung and Hsu Hai L
Home Financials for this Owner
Home Financials are based on the most recent Mortgage that was taken out on this home.
Original Mortgage
$267,300
Interest Rate
7.2%
Create a Home Valuation Report for This Property
The Home Valuation Report is an in-depth analysis detailing your home's value as well as a comparison with similar homes in the area
Home Values in the Area
Average Home Value in this Area
Purchase History
| Date | Buyer | Sale Price | Title Company |
|---|---|---|---|
| Hsu Family Trust | -- | None Listed On Document | |
| Hsu Chung | -- | None Listed On Document | |
| Hsu Andrew | -- | None Listed On Document | |
| Hsu Chung | -- | First American Title Company | |
| Hsu Chung | $297,000 | First American Title Ins Co |
Source: Public Records
Mortgage History
| Date | Status | Borrower | Loan Amount |
|---|---|---|---|
| Previous Owner | Hsu Chung | $417,000 | |
| Previous Owner | Hsu Chung | $267,300 |
Source: Public Records
Tax History
| Year | Tax Paid | Tax Assessment Tax Assessment Total Assessment is a certain percentage of the fair market value that is determined by local assessors to be the total taxable value of land and additions on the property. | Land | Improvement |
|---|---|---|---|---|
| 2025 | $5,549 | $504,799 | $170,496 | $334,303 |
| 2024 | $5,549 | $494,901 | $167,152 | $327,749 |
| 2023 | $5,424 | $485,198 | $163,875 | $321,323 |
| 2022 | $5,317 | $475,685 | $160,662 | $315,023 |
| 2021 | $5,169 | $466,358 | $157,511 | $308,847 |
| 2020 | $5,120 | $461,577 | $155,896 | $305,681 |
| 2019 | $5,056 | $452,527 | $152,839 | $299,688 |
| 2018 | $4,978 | $443,654 | $149,842 | $293,812 |
| 2017 | $4,772 | $434,955 | $146,904 | $288,051 |
| 2016 | $4,679 | $426,427 | $144,024 | $282,403 |
| 2015 | $4,617 | $420,022 | $141,860 | $278,162 |
| 2014 | $4,518 | $411,795 | $139,081 | $272,714 |
Source: Public Records
Map
Nearby Homes
- 6525 E Camino Vista
- 900 S Ridgecrest Cir
- 6595 E Paseo Murillo
- 6535 E Paseo Murillo
- 950 S Rim Crest Dr Unit 12
- 964 S Rim Crest Dr
- 980 S Rutgers Cir
- 990 S Scripps Cir
- 481 S Mohler Dr
- 868 S Calle Venado
- 414 S Cooks Corner
- 6631 E Princeton Ave
- 720 S Ridgeview Rd
- 731 S Ridgeview Rd
- 6437 E Calle Del Norte
- 6520 E Paseo el Greco
- 7130 E Colter Cir
- 730 S Stillwater Ln
- 1070 S Road Runner Rd
- 7584 E Vista Del Sol
- 7126 E Mockingbird Way
- 7144 E Mockingbird Way
- 7142 E Mockingbird Way
- 750 S Goldfinch Way
- 7120 E Mockingbird Way
- 754 S Goldfinch Way
- 744 S Goldfinch Way
- 7146 E Mockingbird Way
- 7133 E Mockingbird Way
- 7125 E Mockingbird Way
- 760 S Goldfinch Way
- 740 S Goldfinch Way
- 7141 E Mockingbird Way
- 7110 E Mockingbird Way
- 7117 E Mockingbird Way
- 7148 E Mockingbird Way
- 764 S Goldfinch Way
- 7149 E Mockingbird Way
- 7152 E Mockingbird Way
- 734 S Goldfinch Way
Your Personal Tour Guide
Ask me questions while you tour the home.