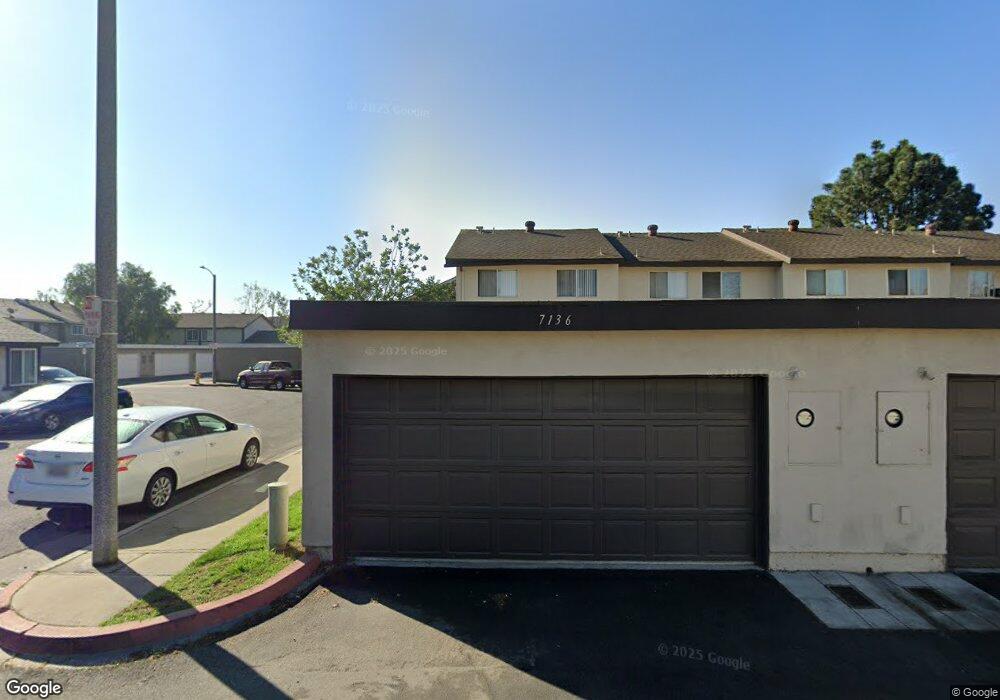
7136 Custer Way Stanton, CA 90680
Estimated Value: $623,000 - $662,107
3
Beds
2
Baths
1,159
Sq Ft
$555/Sq Ft
Est. Value
About This Home
This home is located at 7136 Custer Way, Stanton, CA 90680 and is currently estimated at $643,777, approximately $555 per square foot. 7136 Custer Way is a home located in Orange County with nearby schools including Bryant Elementary School, Hilton D. Bell Intermediate School, and Pacifica High School.
Ownership History
Date
Name
Owned For
Owner Type
Purchase Details
Closed on
Feb 19, 2001
Sold by
Anderson Renee and Eastman Renee
Bought by
Gilliard John and Gilliard Johnnie J
Current Estimated Value
Home Financials for this Owner
Home Financials are based on the most recent Mortgage that was taken out on this home.
Original Mortgage
$150,712
Outstanding Balance
$53,991
Interest Rate
6.97%
Mortgage Type
FHA
Estimated Equity
$589,786
Purchase Details
Closed on
Feb 14, 2001
Sold by
Anderson Brian
Bought by
Anderson Renee
Home Financials for this Owner
Home Financials are based on the most recent Mortgage that was taken out on this home.
Original Mortgage
$150,712
Outstanding Balance
$53,991
Interest Rate
6.97%
Mortgage Type
FHA
Estimated Equity
$589,786
Purchase Details
Closed on
Dec 9, 1997
Sold by
Romero Mary D J and Romero D J
Bought by
Eastman Renee
Home Financials for this Owner
Home Financials are based on the most recent Mortgage that was taken out on this home.
Original Mortgage
$97,303
Interest Rate
7.16%
Mortgage Type
FHA
Create a Home Valuation Report for This Property
The Home Valuation Report is an in-depth analysis detailing your home's value as well as a comparison with similar homes in the area
Home Values in the Area
Average Home Value in this Area
Purchase History
| Date | Buyer | Sale Price | Title Company |
|---|---|---|---|
| Gilliard John | $156,500 | Orange Coast Title | |
| Anderson Renee | -- | Orange Coast Title | |
| Eastman Renee | $98,000 | Orange Coast Title |
Source: Public Records
Mortgage History
| Date | Status | Borrower | Loan Amount |
|---|---|---|---|
| Open | Gilliard John | $150,712 | |
| Previous Owner | Eastman Renee | $97,303 |
Source: Public Records
Tax History
| Year | Tax Paid | Tax Assessment Tax Assessment Total Assessment is a certain percentage of the fair market value that is determined by local assessors to be the total taxable value of land and additions on the property. | Land | Improvement |
|---|---|---|---|---|
| 2025 | $2,935 | $235,508 | $142,321 | $93,187 |
| 2024 | $2,935 | $230,891 | $139,531 | $91,360 |
| 2023 | $2,878 | $226,364 | $136,795 | $89,569 |
| 2022 | $2,833 | $221,926 | $134,113 | $87,813 |
| 2021 | $2,805 | $217,575 | $131,483 | $86,092 |
| 2020 | $2,771 | $215,345 | $130,135 | $85,210 |
| 2019 | $2,705 | $211,123 | $127,583 | $83,540 |
| 2018 | $2,660 | $206,984 | $125,082 | $81,902 |
| 2017 | $2,622 | $202,926 | $122,629 | $80,297 |
| 2016 | $2,516 | $198,948 | $120,225 | $78,723 |
| 2015 | $2,485 | $195,960 | $118,419 | $77,541 |
| 2014 | $2,403 | $192,122 | $116,099 | $76,023 |
Source: Public Records
Map
Nearby Homes
- 7085 Fulton Way
- 7081 Fulton Way
- 7271 Katella Ave Unit 101
- 7271 Katella Ave Unit 99
- 11219 Hood Way
- 10748 Knott Ave
- 10756 Knott Ave
- 6842 Amelia Way
- 10700 Knott Ave
- 6844 Southampton Dr
- 11371 Harkers Ct
- 7251 Middlesex Dr
- 7100 Cerritos Ave Unit 86
- 7100 Cerritos Ave Unit 85
- 10593 Jill St
- 18 Redwood Ct Unit 18
- 15 Redwood Ct Unit 15
- 7129 Cerritos Ave Unit 7
- 6638 Southampton Dr
- 7101 Cerritos Ave Unit 21
- 7134 Custer Way
- 7132 Custer Way
- 7130 Custer Way
- 7128 Custer Way
- 11081 Marryat Way
- 7126 Custer Way
- 7137 Custer Way
- 7135 Custer Way
- 11065 Gentry Way
- 11085 Marryat Way
- 7133 Custer Way
- 11061 Gentry Way
- 7124 Custer Way
- 11057 Gentry Way
- 7131 Custer Way
- 11091 Marryat Way
- 7122 Custer Way
- 7147 Gentry Way
- 11082 Marryat Way
- 11056 Grant Way
Your Personal Tour Guide
Ask me questions while you tour the home.