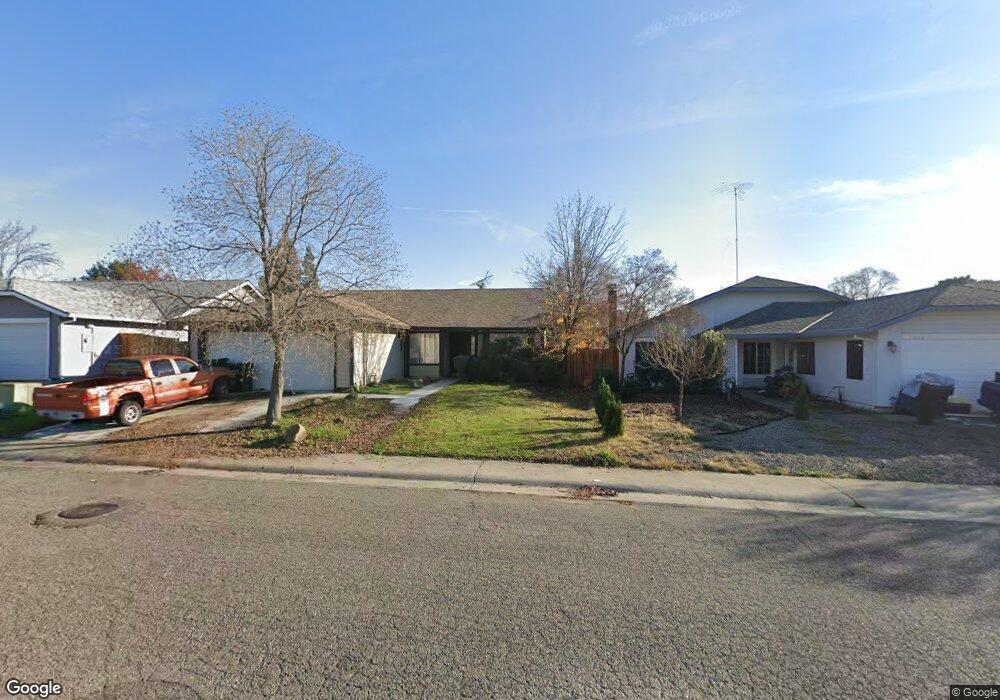
7136 Predial Way Sacramento, CA 95842
Kirkland Place NeighborhoodEstimated Value: $336,000 - $483,000
3
Beds
2
Baths
1,361
Sq Ft
$312/Sq Ft
Est. Value
About This Home
This home is located at 7136 Predial Way, Sacramento, CA 95842 and is currently estimated at $424,169, approximately $311 per square foot. 7136 Predial Way is a home located in Sacramento County with nearby schools including Ridgepoint Elementary School, Highlands High School, and Creative Connections Arts Academy.
Ownership History
Date
Name
Owned For
Owner Type
Purchase Details
Closed on
Jul 30, 2021
Sold by
Gray Jack and Kazarian Roberta L
Bought by
Gray Jack Lee Canton and Kazarian Roberta Lee
Current Estimated Value
Purchase Details
Closed on
Jan 20, 2017
Sold by
Gray Jack and Kazarian Roberta L
Bought by
Gray Jack and Kazarian Roberta L
Home Financials for this Owner
Home Financials are based on the most recent Mortgage that was taken out on this home.
Original Mortgage
$99,000
Outstanding Balance
$81,608
Interest Rate
4.13%
Mortgage Type
New Conventional
Estimated Equity
$342,561
Purchase Details
Closed on
Nov 25, 2002
Sold by
Frank Paul D and Frank Cynthia D
Bought by
Gray Jack and Kazarian Roberta
Home Financials for this Owner
Home Financials are based on the most recent Mortgage that was taken out on this home.
Original Mortgage
$127,968
Interest Rate
6.12%
Purchase Details
Closed on
Jul 25, 2001
Sold by
Frank Paul D and Frank Cynthia D
Bought by
Frank Paul D and Frank Cynthia D
Create a Home Valuation Report for This Property
The Home Valuation Report is an in-depth analysis detailing your home's value as well as a comparison with similar homes in the area
Home Values in the Area
Average Home Value in this Area
Purchase History
| Date | Buyer | Sale Price | Title Company |
|---|---|---|---|
| Gray Jack Lee Canton | -- | None Available | |
| Gray Jack Lee Canton | -- | None Available | |
| Gray Jack | -- | Fidelity National Title Comp | |
| Gray Jack | $171,000 | Financial Title Company | |
| Frank Paul D | -- | -- | |
| Frank Paul D | -- | -- |
Source: Public Records
Mortgage History
| Date | Status | Borrower | Loan Amount |
|---|---|---|---|
| Open | Gray Jack | $99,000 | |
| Closed | Gray Jack | $127,968 |
Source: Public Records
Tax History Compared to Growth
Tax History
| Year | Tax Paid | Tax Assessment Tax Assessment Total Assessment is a certain percentage of the fair market value that is determined by local assessors to be the total taxable value of land and additions on the property. | Land | Improvement |
|---|---|---|---|---|
| 2025 | $2,803 | $247,644 | $65,165 | $182,479 |
| 2024 | $2,803 | $242,789 | $63,888 | $178,901 |
| 2023 | $2,822 | $238,030 | $62,636 | $175,394 |
| 2022 | $2,656 | $233,363 | $61,408 | $171,955 |
| 2021 | $2,649 | $228,788 | $60,204 | $168,584 |
| 2020 | $2,626 | $226,443 | $59,587 | $166,856 |
| 2019 | $2,592 | $222,004 | $58,419 | $163,585 |
| 2018 | $2,463 | $217,652 | $57,274 | $160,378 |
| 2017 | $2,526 | $213,385 | $56,151 | $157,234 |
| 2016 | $2,527 | $209,201 | $55,050 | $154,151 |
| 2015 | $2,295 | $199,034 | $52,376 | $146,658 |
| 2014 | $2,212 | $184,290 | $48,496 | $135,794 |
Source: Public Records
Map
Nearby Homes
- 4840 Dover Ln Unit 406
- 7331 Stratford Place Unit 509
- 7340 Hamden Place Unit 104
- 7340 Hamden Place Unit 103
- 7340 Hamden Place Unit 107
- 7016 Sprig Dr
- 5013 Linenfold Ct
- 4937 Cherryville Ln
- 6925 Sprig Dr
- 7318 La Tour Dr
- 7104 Heather Tree Dr
- 723 Peabody Ct
- 7531 Event Way
- 7535 Event Way
- 6621 Weatherby Way
- 6859 Butterball Way
- 4541 Fox Valley Cir
- 6824 Harlequin Way
- 6629 Foxtail Ct
- 7631 Conklin Ct
- 7140 Predial Way
- 7132 Predial Way
- 7117 Benevolent Way
- 7128 Predial Way
- 7144 Predial Way
- 7121 Benevolent Way
- 7113 Benevolent Way
- 4821 Adieu Ct
- 4820 Adieu Ct
- 7109 Benevolent Way
- 7125 Benevolent Way
- 7124 Predial Way
- 7148 Predial Way
- 7105 Benevolent Way
- 4817 Adieu Ct
- 7129 Benevolent Way
- 4816 Adieu Ct
- 4820 Savant Dr
- 7143 Essence Way
- 7120 Predial Way