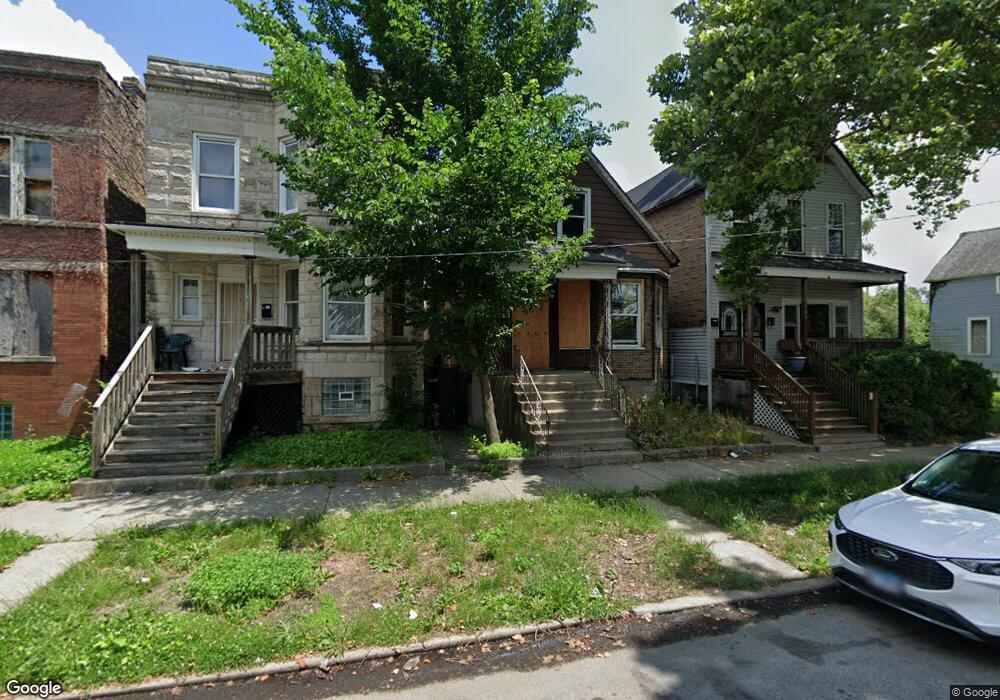
7137 S Sangamon St Chicago, IL 60621
Englewood NeighborhoodEstimated Value: $81,927 - $122,000
4
Beds
1
Bath
909
Sq Ft
$109/Sq Ft
Est. Value
About This Home
This home is located at 7137 S Sangamon St, Chicago, IL 60621 and is currently estimated at $99,232, approximately $109 per square foot. 7137 S Sangamon St is a home located in Cook County with nearby schools including Bond Elementary School.
Ownership History
Date
Name
Owned For
Owner Type
Purchase Details
Closed on
Nov 18, 2010
Sold by
Usa Rental Fund Llc
Bought by
Brooks Rl
Current Estimated Value
Purchase Details
Closed on
Aug 9, 2010
Sold by
Fannie Mae
Bought by
Usa Rental Fund Llc
Purchase Details
Closed on
Apr 19, 2010
Sold by
Rosenthal Cary R
Bought by
Federal National Mortgage Association
Purchase Details
Closed on
Jul 16, 2002
Sold by
Carter Rosa
Bought by
Marshall Tinnie
Home Financials for this Owner
Home Financials are based on the most recent Mortgage that was taken out on this home.
Original Mortgage
$78,300
Interest Rate
6.79%
Purchase Details
Closed on
Feb 11, 1999
Sold by
Marshall Tinnie
Bought by
Marshall Tinnie and Carter Rosa
Home Financials for this Owner
Home Financials are based on the most recent Mortgage that was taken out on this home.
Original Mortgage
$73,000
Interest Rate
6.88%
Create a Home Valuation Report for This Property
The Home Valuation Report is an in-depth analysis detailing your home's value as well as a comparison with similar homes in the area
Home Values in the Area
Average Home Value in this Area
Purchase History
| Date | Buyer | Sale Price | Title Company |
|---|---|---|---|
| Brooks Rl | $6,500 | Cti | |
| Usa Rental Fund Llc | $500 | None Available | |
| Federal National Mortgage Association | -- | None Available | |
| Marshall Tinnie | -- | -- | |
| Marshall Tinnie | -- | -- |
Source: Public Records
Mortgage History
| Date | Status | Borrower | Loan Amount |
|---|---|---|---|
| Previous Owner | Marshall Tinnie | $78,300 | |
| Previous Owner | Marshall Tinnie | $73,000 |
Source: Public Records
Tax History Compared to Growth
Tax History
| Year | Tax Paid | Tax Assessment Tax Assessment Total Assessment is a certain percentage of the fair market value that is determined by local assessors to be the total taxable value of land and additions on the property. | Land | Improvement |
|---|---|---|---|---|
| 2024 | $633 | $3,901 | $938 | $2,963 |
| 2023 | $617 | $3,000 | $1,561 | $1,439 |
| 2022 | $617 | $3,000 | $1,561 | $1,439 |
| 2021 | $603 | $3,000 | $1,562 | $1,438 |
| 2020 | $1,271 | $5,706 | $2,343 | $3,363 |
| 2019 | $1,274 | $6,340 | $2,343 | $3,997 |
| 2018 | $1,252 | $6,340 | $2,343 | $3,997 |
| 2017 | $1,632 | $7,582 | $2,031 | $5,551 |
| 2016 | $1,519 | $7,582 | $2,031 | $5,551 |
| 2015 | $1,389 | $7,582 | $2,031 | $5,551 |
| 2014 | $1,327 | $7,152 | $1,875 | $5,277 |
| 2013 | $1,301 | $7,152 | $1,875 | $5,277 |
Source: Public Records
Map
Nearby Homes
- 7157 S Sangamon St
- 7123 S Peoria St
- 7137 S Carpenter St
- 7141 S Peoria St
- 7128 S Carpenter St
- 7225 S Sangamon St
- 7233 S Sangamon St
- 7228 S Morgan St
- 7151 S Aberdeen St
- 7243 S Sangamon St
- 7028 S Carpenter St
- 7244 S Sangamon St
- 7220 S Carpenter St
- 7233 S Peoria St
- 7126 S Aberdeen St
- 6945 S Peoria St
- 7232 S Aberdeen St
- 7311 S Peoria St
- 7144 S May St
- 6929 S Peoria St
- 7135 S Sangamon St
- 7135 S Sangamon St Unit 1
- 7135 S Sangamon St
- 7141 S Sangamon St
- 7133 S Sangamon St
- 7129 S Sangamon St
- 7127 S Sangamon St
- 7147 S Sangamon St
- 7149 S Sangamon St
- 7123 S Sangamon St
- 7123 S Sangamon St
- 7153 S Sangamon St
- 7136 S Peoria St
- 7134 S Peoria St
- 7132 S Peoria St
- 7132 S Sangamon St
- 7155 S Sangamon St Unit 2
- 7155 S Sangamon St Unit A
- 7155 S Sangamon St Unit G