7139 S May St Unit 1 Chicago, IL 60621
Englewood NeighborhoodEstimated Value: $160,000 - $196,899
3
Beds
1
Bath
1,360
Sq Ft
$131/Sq Ft
Est. Value
About This Home
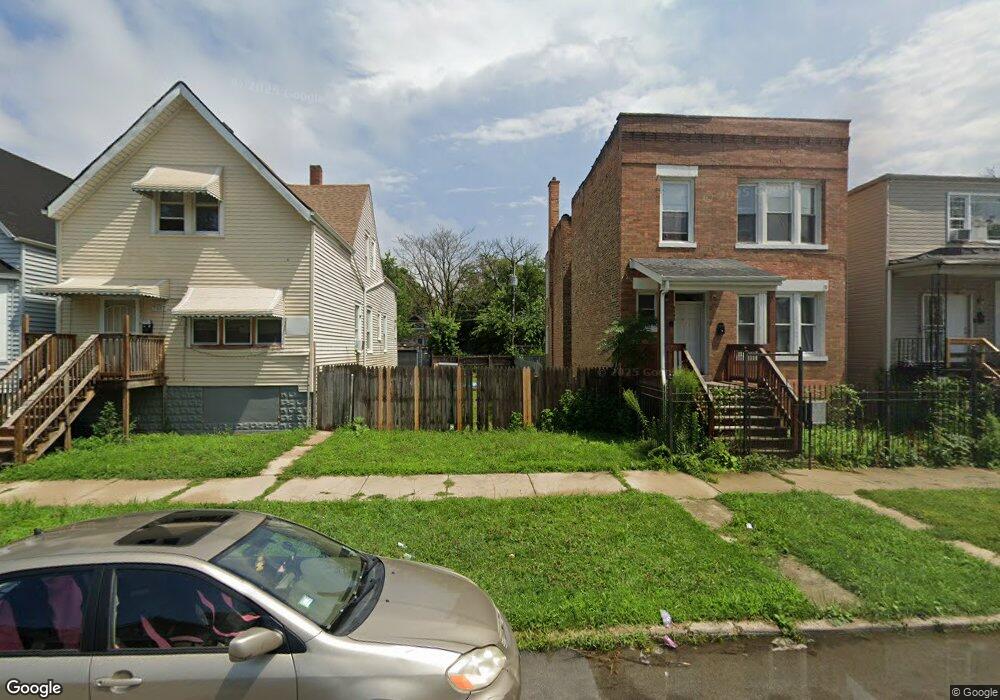
This home is located at 7139 S May St Unit 1, Chicago, IL 60621 and is currently estimated at $178,450, approximately $131 per square foot. 7139 S May St Unit 1 is a home located in Cook County with nearby schools including Bond Elementary School and St Sabina Academy.
Ownership History
Date
Name
Owned For
Owner Type
Purchase Details
Closed on
Dec 17, 2018
Sold by
Home Opportunity Llc
Bought by
Lakeside Portfolio Advisors Llc
Current Estimated Value
Purchase Details
Closed on
Apr 24, 2018
Sold by
Transportation Alliance Bank Inc
Bought by
Home Opportunity Llc
Purchase Details
Closed on
Jun 12, 2012
Sold by
Home Solutions Partners Iv Reo Llc
Bought by
Transportation Alliance Bank Inc
Purchase Details
Closed on
Apr 30, 2009
Sold by
Landmark Reo Club Llc
Bought by
Vaughn Street Llc
Purchase Details
Closed on
Dec 29, 2008
Sold by
Liquidation Properties Inc
Bought by
Landmark Reo Club Llc
Purchase Details
Closed on
Aug 23, 2007
Sold by
Gilmore Derrick
Bought by
Liquidation Properties Inc
Purchase Details
Closed on
Aug 4, 2005
Sold by
Alford June E
Bought by
Gilmore Derrick
Home Financials for this Owner
Home Financials are based on the most recent Mortgage that was taken out on this home.
Original Mortgage
$137,750
Interest Rate
8.8%
Mortgage Type
Commercial
Purchase Details
Closed on
Aug 25, 1999
Sold by
Gulledge Ilonia D
Bought by
Alford June E
Create a Home Valuation Report for This Property
The Home Valuation Report is an in-depth analysis detailing your home's value as well as a comparison with similar homes in the area
Home Values in the Area
Average Home Value in this Area
Purchase History
| Date | Buyer | Sale Price | Title Company |
|---|---|---|---|
| Lakeside Portfolio Advisors Llc | -- | Attorney | |
| Home Opportunity Llc | -- | Timios Inc | |
| Transportation Alliance Bank Inc | $11,912 | None Available | |
| Vaughn Street Llc | $14,000 | None Available | |
| Landmark Reo Club Llc | -- | None Available | |
| Liquidation Properties Inc | -- | None Available | |
| Gilmore Derrick | $145,000 | -- | |
| Alford June E | -- | -- |
Source: Public Records
Mortgage History
| Date | Status | Borrower | Loan Amount |
|---|---|---|---|
| Previous Owner | Gilmore Derrick | $137,750 |
Source: Public Records
Tax History Compared to Growth
Tax History
| Year | Tax Paid | Tax Assessment Tax Assessment Total Assessment is a certain percentage of the fair market value that is determined by local assessors to be the total taxable value of land and additions on the property. | Land | Improvement |
|---|---|---|---|---|
| 2024 | $429 | $938 | $938 | -- |
| 2023 | $418 | $2,031 | $2,031 | -- |
| 2022 | $418 | $2,031 | $2,031 | $0 |
| 2021 | $408 | $2,031 | $2,031 | $0 |
| 2020 | $522 | $2,343 | $2,343 | $0 |
| 2019 | $471 | $2,343 | $2,343 | $0 |
| 2018 | $463 | $2,343 | $2,343 | $0 |
| 2017 | $1,820 | $8,454 | $2,031 | $6,423 |
| 2016 | $1,693 | $8,454 | $2,031 | $6,423 |
| 2015 | $1,549 | $8,454 | $2,031 | $6,423 |
| 2014 | $1,582 | $8,528 | $1,875 | $6,653 |
| 2013 | $1,551 | $8,528 | $1,875 | $6,653 |
Source: Public Records
Map
Nearby Homes
- 7144 S May St
- 7126 S Aberdeen St
- 7151 S Aberdeen St
- 7042 S Racine Ave
- 7128 S Carpenter St
- 7238 S May St
- 7232 S Aberdeen St
- 7137 S Carpenter St
- 7220 S Carpenter St
- 7028 S Carpenter St
- 7041 S Throop St
- 7022 S Elizabeth St
- 7130 S Morgan St
- 1241 W 72nd Place
- 7050 S Throop St
- 7019 S Throop St
- 7300 S Racine Ave
- 6946 S May St
- 6953 S Elizabeth St
- 6944 S Racine Ave
- 7139 S May St
- 7137 S May St
- 7141 S May St Unit 2
- 7141 S May St
- 7135 S May St
- 7143 S May St
- 7131 S May St
- 7145 S May St
- 7147 S May St Unit 2
- 7147 S May St
- 7129 S May St
- 7151 S May St
- 7151 S May St
- 7127 S May St
- 7138 S Aberdeen St
- 7140 S Aberdeen St
- 7136 S Aberdeen St
- 7142 S Aberdeen St
- 7123 S May St
- 7146 S Aberdeen St