Estimated Value: $216,384 - $256,000
5
Beds
2
Baths
1,952
Sq Ft
$118/Sq Ft
Est. Value
About This Home
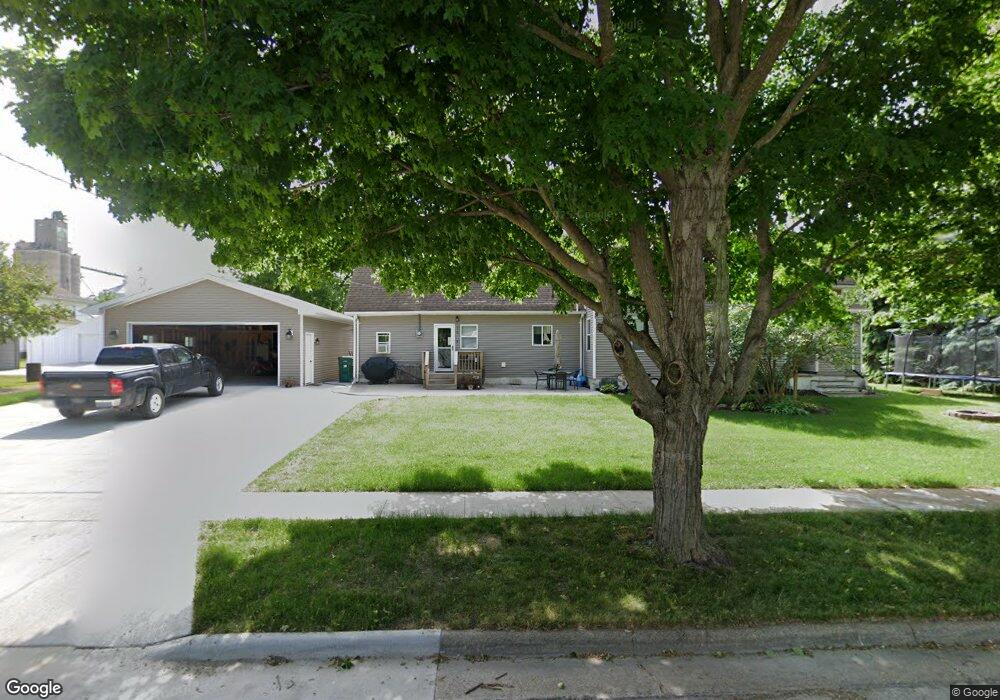
This home is located at 714 9th St, Jesup, IA 50648 and is currently estimated at $230,096, approximately $117 per square foot. 714 9th St is a home located in Buchanan County with nearby schools including Jesup Elementary School, Jesup Middle School, and Jesup High School.
Ownership History
Date
Name
Owned For
Owner Type
Purchase Details
Closed on
Oct 12, 2012
Sold by
Hopkins Irma O
Bought by
Sebetka Blue D and Sebetka Cathy J
Current Estimated Value
Home Financials for this Owner
Home Financials are based on the most recent Mortgage that was taken out on this home.
Original Mortgage
$140,311
Outstanding Balance
$97,344
Interest Rate
3.55%
Mortgage Type
FHA
Estimated Equity
$132,752
Purchase Details
Closed on
Sep 27, 2012
Sold by
Sebetka Blue D and Sebetka Cathy J
Bought by
Menuey Paul L and Menuey Nicole R
Home Financials for this Owner
Home Financials are based on the most recent Mortgage that was taken out on this home.
Original Mortgage
$140,311
Outstanding Balance
$97,344
Interest Rate
3.55%
Mortgage Type
FHA
Estimated Equity
$132,752
Purchase Details
Closed on
Jun 4, 2007
Sold by
Neuendorf Ronald E and Neuendorf Margaret M
Bought by
Sebetka Blue D and Sebetka Cathy J
Create a Home Valuation Report for This Property
The Home Valuation Report is an in-depth analysis detailing your home's value as well as a comparison with similar homes in the area
Home Values in the Area
Average Home Value in this Area
Purchase History
| Date | Buyer | Sale Price | Title Company |
|---|---|---|---|
| Sebetka Blue D | $141,000 | None Available | |
| Menuey Paul L | $143,000 | None Available | |
| Sebetka Blue D | $129,000 | None Available |
Source: Public Records
Mortgage History
| Date | Status | Borrower | Loan Amount |
|---|---|---|---|
| Open | Menuey Paul L | $140,311 |
Source: Public Records
Tax History Compared to Growth
Tax History
| Year | Tax Paid | Tax Assessment Tax Assessment Total Assessment is a certain percentage of the fair market value that is determined by local assessors to be the total taxable value of land and additions on the property. | Land | Improvement |
|---|---|---|---|---|
| 2025 | $2,992 | $199,060 | $24,140 | $174,920 |
| 2024 | $2,992 | $173,760 | $21,560 | $152,200 |
| 2023 | $2,922 | $174,960 | $21,560 | $153,400 |
| 2022 | $2,644 | $139,300 | $17,110 | $122,190 |
| 2021 | $2,612 | $139,300 | $17,110 | $122,190 |
| 2020 | $2,612 | $130,060 | $15,680 | $114,380 |
| 2019 | $2,566 | $130,060 | $15,680 | $114,380 |
| 2018 | $2,432 | $127,460 | $15,680 | $111,780 |
| 2017 | $2,650 | $127,460 | $15,680 | $111,780 |
| 2016 | $2,586 | $135,670 | $8,490 | $127,180 |
| 2015 | $2,586 | $135,670 | $8,490 | $127,180 |
| 2014 | $2,628 | $135,670 | $8,490 | $127,180 |
Source: Public Records
Map
Nearby Homes