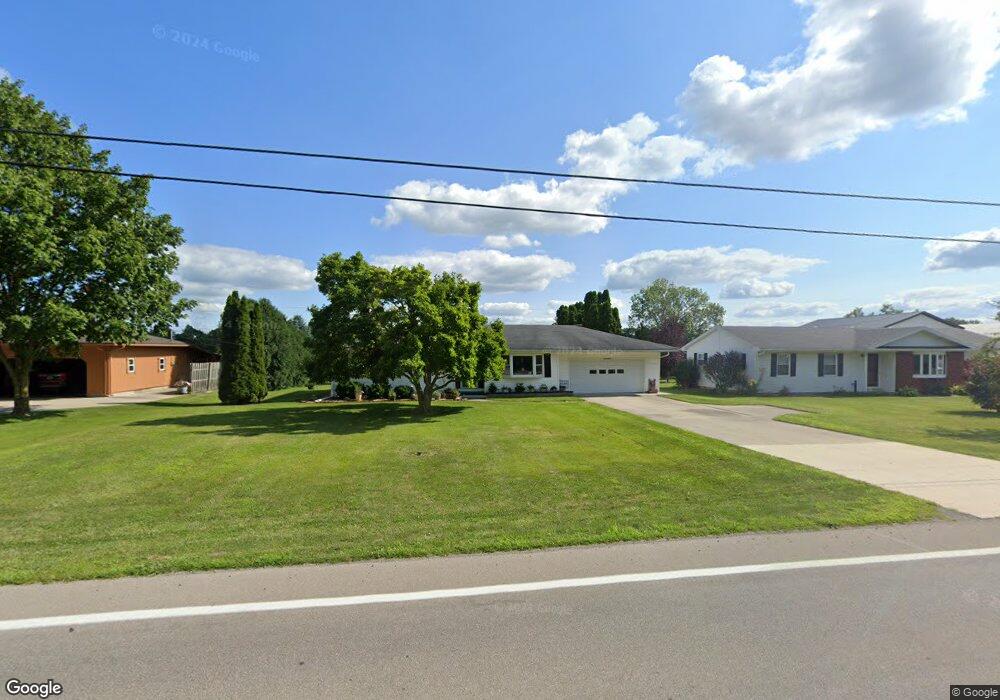
714 E Jackson St West Unity, OH 43570
Estimated Value: $158,000 - $173,132
3
Beds
2
Baths
1,524
Sq Ft
$109/Sq Ft
Est. Value
About This Home
This home is located at 714 E Jackson St, West Unity, OH 43570 and is currently estimated at $166,033, approximately $108 per square foot. 714 E Jackson St is a home located in Williams County with nearby schools including Hilltop Elementary School and Hilltop High School.
Ownership History
Date
Name
Owned For
Owner Type
Purchase Details
Closed on
Jun 17, 2008
Sold by
Carrington Arlene and Carrington Arlene N
Bought by
Briskey Donna C
Current Estimated Value
Home Financials for this Owner
Home Financials are based on the most recent Mortgage that was taken out on this home.
Original Mortgage
$65,000
Outstanding Balance
$41,193
Interest Rate
6.15%
Mortgage Type
Purchase Money Mortgage
Estimated Equity
$124,840
Purchase Details
Closed on
May 5, 2008
Sold by
Estate Of Vernell Edward Carrington
Bought by
Carrington Arlene
Home Financials for this Owner
Home Financials are based on the most recent Mortgage that was taken out on this home.
Original Mortgage
$65,000
Outstanding Balance
$41,193
Interest Rate
6.15%
Mortgage Type
Purchase Money Mortgage
Estimated Equity
$124,840
Purchase Details
Closed on
Jan 1, 1990
Bought by
Carrington Vernell E
Create a Home Valuation Report for This Property
The Home Valuation Report is an in-depth analysis detailing your home's value as well as a comparison with similar homes in the area
Purchase History
| Date | Buyer | Sale Price | Title Company |
|---|---|---|---|
| Briskey Donna C | $76,000 | None Available | |
| Carrington Arlene | -- | None Available | |
| Carrington Vernell E | -- | -- |
Source: Public Records
Mortgage History
| Date | Status | Borrower | Loan Amount |
|---|---|---|---|
| Open | Briskey Donna C | $65,000 |
Source: Public Records
Tax History
| Year | Tax Paid | Tax Assessment Tax Assessment Total Assessment is a certain percentage of the fair market value that is determined by local assessors to be the total taxable value of land and additions on the property. | Land | Improvement |
|---|---|---|---|---|
| 2025 | $1,686 | $41,730 | $6,690 | $35,040 |
| 2024 | $1,686 | $41,730 | $6,690 | $35,040 |
| 2023 | $1,715 | $32,070 | $6,550 | $25,520 |
| 2022 | $1,567 | $32,070 | $6,550 | $25,520 |
| 2021 | $1,567 | $32,070 | $6,550 | $25,520 |
| 2020 | $1,412 | $27,900 | $5,710 | $22,190 |
| 2019 | $1,391 | $27,900 | $5,710 | $22,190 |
| 2018 | $703 | $27,900 | $5,710 | $22,190 |
| 2017 | $1,192 | $23,670 | $5,430 | $18,240 |
| 2016 | $1,137 | $23,670 | $5,430 | $18,240 |
| 2015 | $1,296 | $23,670 | $5,430 | $18,240 |
| 2014 | $1,296 | $24,890 | $5,710 | $19,180 |
| 2013 | $1,279 | $24,890 | $5,710 | $19,180 |
Source: Public Records
Map
Nearby Homes
- 902 E Church St
- 000 W Jackson
- 106 W Catherine St
- 309 S Defiance St
- 22227 Us Highway 20a
- 20095 County Road H50
- 16806 US Highway 20a
- 3514 Gaslight Dr
- 301 Horton St
- 14640 U S 20a
- 23161 County Road Jk
- 200 Tyler Ln
- 552 Quail Run
- 0 St Rt 15 Unit 10001011
- 16299 County Road F75
- 0 US Highway 20a
- 301 N Pointe Dr
- 328 W Lutz Rd Unit 328
- 7100 County Road 15-50
- 408 Ditto St
- 712 E Jackson St
- 716 E Jackson St
- 718 E Jackson St
- 715 E Jackson St
- 719 E Jackson St
- 720 E Jackson St
- 721 E Jackson St
- 716 E North St
- 718 E North St
- 711 E Jackson St
- 714 E North St
- 720 E North St
- 722 E Jackson St
- 712 E North St
- 722 E North St
- 709 E Jackson St
- 710 E North St
- 725 E Jackson St
- 21 County Road 21n
- 715 E North St Unit 11
Your Personal Tour Guide
Ask me questions while you tour the home.