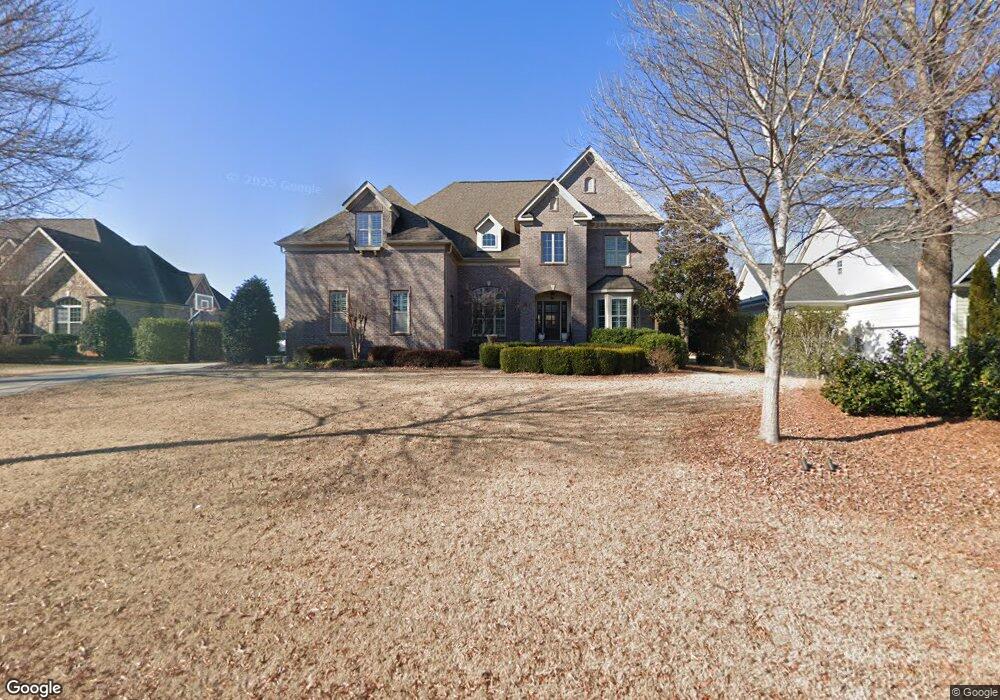
714 Mendenhall Ct Unit 3 Fort Mill, SC 29715
Springfield NeighborhoodEstimated Value: $1,220,000 - $1,349,931
4
Beds
4
Baths
3,650
Sq Ft
$356/Sq Ft
Est. Value
About This Home
This home is located at 714 Mendenhall Ct Unit 3, Fort Mill, SC 29715 and is currently estimated at $1,298,733, approximately $355 per square foot. 714 Mendenhall Ct Unit 3 is a home located in York County with nearby schools including Fort Mill Elementary School, Fort Mill Middle School, and Nation Ford High School.
Ownership History
Date
Name
Owned For
Owner Type
Purchase Details
Closed on
Jun 10, 2021
Sold by
Land Jonathan A and Land Jenna L
Bought by
Land Jonathan Allan and Land Jenna Lynn
Current Estimated Value
Purchase Details
Closed on
Jun 7, 2012
Sold by
Shea Real Estate Investments Llc
Bought by
Land Jonathan A and Land Jenna L
Home Financials for this Owner
Home Financials are based on the most recent Mortgage that was taken out on this home.
Original Mortgage
$378,400
Outstanding Balance
$262,613
Interest Rate
3.86%
Mortgage Type
New Conventional
Estimated Equity
$1,036,120
Purchase Details
Closed on
Sep 9, 2011
Sold by
Fifth Third Bank
Bought by
Shea Real Estate Investments Llc
Purchase Details
Closed on
Apr 16, 2010
Sold by
Cyras Homes Inc
Bought by
Tricon Properties Llc
Create a Home Valuation Report for This Property
The Home Valuation Report is an in-depth analysis detailing your home's value as well as a comparison with similar homes in the area
Home Values in the Area
Average Home Value in this Area
Purchase History
| Date | Buyer | Sale Price | Title Company |
|---|---|---|---|
| Land Jonathan Allan | -- | None Available | |
| Land Jonathan A | $473,000 | -- | |
| Shea Real Estate Investments Llc | $70,000 | -- | |
| Tricon Properties Llc | -- | -- |
Source: Public Records
Mortgage History
| Date | Status | Borrower | Loan Amount |
|---|---|---|---|
| Open | Land Jonathan A | $378,400 | |
| Closed | Land Jonathan A | $47,300 |
Source: Public Records
Tax History Compared to Growth
Tax History
| Year | Tax Paid | Tax Assessment Tax Assessment Total Assessment is a certain percentage of the fair market value that is determined by local assessors to be the total taxable value of land and additions on the property. | Land | Improvement |
|---|---|---|---|---|
| 2024 | $5,871 | $24,201 | $7,261 | $16,940 |
| 2023 | $5,740 | $24,200 | $7,262 | $16,938 |
| 2022 | $5,570 | $24,200 | $7,262 | $16,938 |
| 2021 | -- | $24,200 | $7,262 | $16,938 |
| 2020 | $5,800 | $24,200 | $0 | $0 |
| 2019 | $5,865 | $21,104 | $0 | $0 |
| 2018 | $6,133 | $21,104 | $0 | $0 |
| 2017 | $5,892 | $23,880 | $0 | $0 |
| 2016 | $5,871 | $21,104 | $0 | $0 |
| 2014 | $2,127 | $21,104 | $3,908 | $17,196 |
| 2013 | $2,127 | $18,300 | $3,400 | $14,900 |
Source: Public Records
Map
Nearby Homes
- 330 Horton Grove Rd
- 1157 Wessington Manor Ln
- 1460 Kilburn Ln
- 1565 Kennel Rd
- 105 Redcoat Dr
- 323 Swamp Fox Dr
- 238 Cherrytree Dr
- 945 Vogel Way
- 121 Pelham Ln
- 1290 Lange Ct
- 1266 Lange Ct
- 3128 Beacon Heights Rd
- 3116 Beacon Heights Rd
- 3139 Beacon Heights Rd
- 3137 Beacon Heights Rd
- 524 Becker Ave
- 3135 Beacon Heights Rd
- 3127 Beacon Heights Rd
- 3131 Beacon Heights Rd
- 3117 Beacon Heights Rd
- 714 Mendenhall Ct
- 710 Mendenhall Ct
- 718 Mendenhall Ct Unit 4
- 724 Mendenhall Ct
- 724 Mendenhall Ct Unit 5
- 706 Mendenhall Ct
- 715 Mendenhall Ct
- 719 Mendenhall Ct Unit 23
- 719 Mendenhall Ct
- 711 Mendenhall Ct Unit , 25
- 711 Mendenhall Ct
- 789 Mendenhall Ct
- 723 Mendenhall Ct
- 707 Mendenhall Ct Unit 26
- 707 Mendenhall Ct
- Lot25 Mendenhall Ct
- 727 Mendenhall Ct
- 783 Mendenhall Ct
- 619 Hambley House Ln
- 623 Hambley House Ln Unit 107