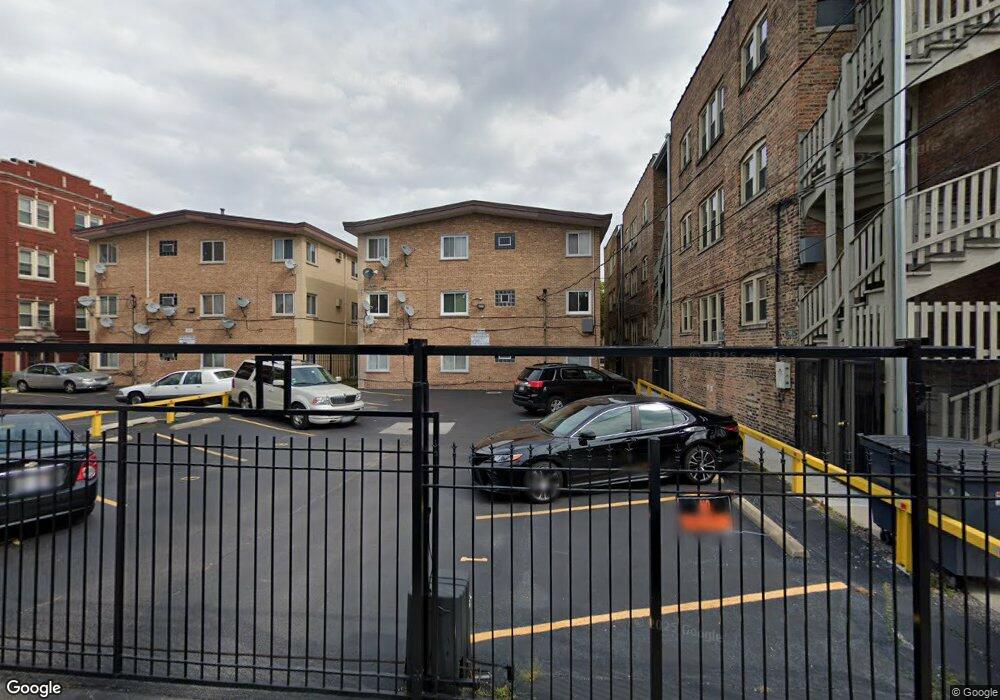
714 N Austin Blvd Unit 1NW Oak Park, IL 60302
Estimated Value: $127,000 - $174,000
2
Beds
1
Bath
9,420
Sq Ft
$16/Sq Ft
Est. Value
About This Home
This home is located at 714 N Austin Blvd Unit 1NW, Oak Park, IL 60302 and is currently estimated at $146,815, approximately $15 per square foot. 714 N Austin Blvd Unit 1NW is a home located in Cook County with nearby schools including William Beye Elementary School, Percy Julian Middle School, and Oak Park and River Forest High School.
Ownership History
Date
Name
Owned For
Owner Type
Purchase Details
Closed on
Oct 11, 2022
Sold by
Spearman James
Bought by
Ellis Traci D and Ellis Jalen R
Current Estimated Value
Home Financials for this Owner
Home Financials are based on the most recent Mortgage that was taken out on this home.
Original Mortgage
$72,750
Outstanding Balance
$70,496
Interest Rate
7.13%
Mortgage Type
New Conventional
Estimated Equity
$76,319
Purchase Details
Closed on
Apr 28, 2010
Sold by
Mohammed Saleem
Bought by
Spearman James and Spearman Margaret
Purchase Details
Closed on
Mar 31, 2010
Sold by
Lawson Stella
Bought by
Mohammed Saleem
Purchase Details
Closed on
Jul 18, 2006
Sold by
Jordan Cedric A
Bought by
Hounmali Neyovi M and Lawson Stella
Home Financials for this Owner
Home Financials are based on the most recent Mortgage that was taken out on this home.
Original Mortgage
$109,600
Interest Rate
8.3%
Mortgage Type
Unknown
Create a Home Valuation Report for This Property
The Home Valuation Report is an in-depth analysis detailing your home's value as well as a comparison with similar homes in the area
Home Values in the Area
Average Home Value in this Area
Purchase History
| Date | Buyer | Sale Price | Title Company |
|---|---|---|---|
| Ellis Traci D | -- | First American Title | |
| Spearman James | $69,000 | Git | |
| Mohammed Saleem | $24,000 | Git | |
| Hounmali Neyovi M | $137,000 | First American Title Ins Co |
Source: Public Records
Mortgage History
| Date | Status | Borrower | Loan Amount |
|---|---|---|---|
| Open | Ellis Traci D | $72,750 | |
| Previous Owner | Hounmali Neyovi M | $109,600 |
Source: Public Records
Tax History Compared to Growth
Tax History
| Year | Tax Paid | Tax Assessment Tax Assessment Total Assessment is a certain percentage of the fair market value that is determined by local assessors to be the total taxable value of land and additions on the property. | Land | Improvement |
|---|---|---|---|---|
| 2024 | $2,704 | $8,294 | $1,108 | $7,186 |
| 2023 | $4,172 | $8,294 | $1,108 | $7,186 |
| 2022 | $4,172 | $10,866 | $725 | $10,141 |
| 2021 | $4,065 | $10,864 | $724 | $10,140 |
| 2020 | $3,966 | $10,864 | $724 | $10,140 |
| 2019 | $3,969 | $10,345 | $660 | $9,685 |
| 2018 | $3,820 | $10,345 | $660 | $9,685 |
| 2017 | $4,893 | $13,548 | $660 | $12,888 |
| 2016 | $2,777 | $6,900 | $554 | $6,346 |
| 2015 | $2,488 | $6,900 | $554 | $6,346 |
| 2014 | $2,312 | $6,900 | $554 | $6,346 |
| 2013 | $2,186 | $9,347 | $554 | $8,793 |
Source: Public Records
Map
Nearby Homes
- 403 N Humphrey Ave
- 824 N Austin Blvd Unit 3E
- 5939 W Huron St
- 62 Chicago Ave
- 546 N Humphrey Ave
- 5927 W Erie St
- 5962 W Iowa St
- 120 Chicago Ave Unit A
- 5901 W Erie St
- 914 N Austin Blvd Unit A5
- 217 Chicago Ave Unit 3
- 5828 W Iowa St
- 19 Augusta St
- 840 N Massasoit Ave
- 143 N Taylor Ave
- 1032 N Austin Blvd Unit 2N
- 126 N Taylor Ave Unit 1S
- 5731 W Ohio St
- 802 N Taylor Ave
- 836 N Parkside Ave
- 714 N Austin Blvd Unit GNE
- 714 N Austin Blvd Unit 2E
- 714 N Austin Blvd Unit GNW
- 714 N Austin Blvd Unit 2SW
- 714 N Austin Blvd Unit 1SE
- 714 N Austin Blvd Unit 1NE
- 714 N Austin Blvd Unit GSW
- 714 N Austin Blvd Unit 2NW
- 714 N Austin Blvd Unit 1SW
- 714 N Austin Blvd Unit 302
- 714 N Austin Blvd Unit 201
- 714 N Austin Blvd Unit 103
- 714 N Austin Blvd Unit 202
- 714 N Austin Blvd Unit 101
- 714 N Austin Blvd Unit 204
- 720 N Austin Blvd Unit 2NW
- 720 N Austin Blvd Unit GSW
- 720 N Austin Blvd Unit 1NE
- 720 N Austin Blvd Unit 2E
- 720 N Austin Blvd Unit 1NW