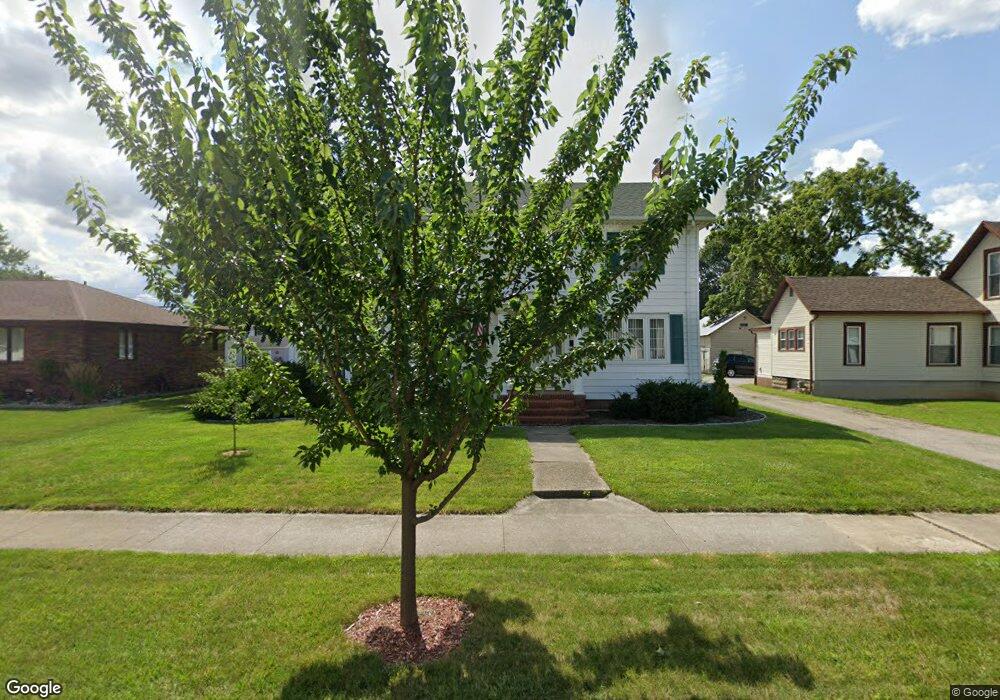
714 N Williams St Paulding, OH 45879
Estimated Value: $144,208 - $186,000
3
Beds
2
Baths
1,704
Sq Ft
$95/Sq Ft
Est. Value
About This Home
This home is located at 714 N Williams St, Paulding, OH 45879 and is currently estimated at $162,052, approximately $95 per square foot. 714 N Williams St is a home located in Paulding County with nearby schools including Paulding High School.
Ownership History
Date
Name
Owned For
Owner Type
Purchase Details
Closed on
Mar 29, 2010
Sold by
Cross Roads Venture Group Llc
Bought by
Mobley Richard W and Mobley Sophia A
Current Estimated Value
Home Financials for this Owner
Home Financials are based on the most recent Mortgage that was taken out on this home.
Original Mortgage
$90,886
Outstanding Balance
$60,623
Interest Rate
5.03%
Mortgage Type
FHA
Estimated Equity
$101,429
Purchase Details
Closed on
Dec 31, 2009
Sold by
U S Bank National Assn
Bought by
Cross Road Venture Group Llc
Purchase Details
Closed on
Oct 6, 2009
Sold by
Iler Gregory J and Iler Gregory James
Bought by
U S Bank Na
Purchase Details
Closed on
Sep 16, 2005
Sold by
Reinhart Robert and Reinhart Rosemarie
Bought by
Iier Gregory J
Home Financials for this Owner
Home Financials are based on the most recent Mortgage that was taken out on this home.
Original Mortgage
$113,500
Interest Rate
9.63%
Mortgage Type
Adjustable Rate Mortgage/ARM
Create a Home Valuation Report for This Property
The Home Valuation Report is an in-depth analysis detailing your home's value as well as a comparison with similar homes in the area
Home Values in the Area
Average Home Value in this Area
Purchase History
| Date | Buyer | Sale Price | Title Company |
|---|---|---|---|
| Mobley Richard W | $75,000 | None Available | |
| Cross Road Venture Group Llc | $60,000 | None Available | |
| U S Bank Na | $56,000 | None Available | |
| Iier Gregory J | $119,500 | None Available |
Source: Public Records
Mortgage History
| Date | Status | Borrower | Loan Amount |
|---|---|---|---|
| Open | Mobley Richard W | $90,886 | |
| Previous Owner | Iier Gregory J | $113,500 |
Source: Public Records
Tax History Compared to Growth
Tax History
| Year | Tax Paid | Tax Assessment Tax Assessment Total Assessment is a certain percentage of the fair market value that is determined by local assessors to be the total taxable value of land and additions on the property. | Land | Improvement |
|---|---|---|---|---|
| 2024 | $1,655 | $36,820 | $5,810 | $31,010 |
| 2023 | $1,655 | $36,820 | $5,810 | $31,010 |
| 2022 | $1,604 | $36,820 | $5,810 | $31,010 |
| 2021 | $1,485 | $30,350 | $5,360 | $24,990 |
| 2020 | $1,328 | $30,350 | $5,360 | $24,990 |
| 2019 | $1,339 | $30,350 | $5,360 | $24,990 |
| 2018 | $1,363 | $30,350 | $5,360 | $24,990 |
| 2017 | $1,364 | $30,350 | $5,360 | $24,990 |
| 2016 | $1,364 | $30,350 | $5,360 | $24,990 |
| 2015 | $1,398 | $31,580 | $4,940 | $26,640 |
| 2014 | $1,391 | $31,580 | $4,940 | $26,640 |
| 2013 | $1,505 | $31,580 | $4,940 | $26,640 |
Source: Public Records
Map
Nearby Homes
- Tract 2 - 0000 Ohio 111
- 0000 Ohio 111
- 606 Lincoln Ave
- 418 E Baldwin St
- 752 N Dix St
- 215 N Dewitt St
- 614 W Jackson St
- 300 S Williams St
- 720 W Perry St
- 717 W Harrison St
- 907 Country View Dr
- 720 W Wayne St
- 0 Road 111
- 1045 Emerald Rd
- 1051 Emerald Rd
- 1065 Emerald Rd
- 13120 Helen St
- 13678 Nancy St
- 12052 Dennis St
- 825 Johnson Rd
- 708 N Williams St
- 715 N Williams St
- 702 N Williams St
- 709 N Williams St
- 720 N Williams St
- 726 N Williams St
- 721 N Williams St
- 715 N Cherry St
- 709 N Cherry St
- 721 N Cherry St
- 703 N Cherry St
- 727 N Williams St
- 732 N Williams St
- 626 N Williams St
- 733 N Williams St
- 627 N Williams St
- 121 W Baldwin Ave
- 738 N Williams St
- 620 N Williams St
- 714 N Main St