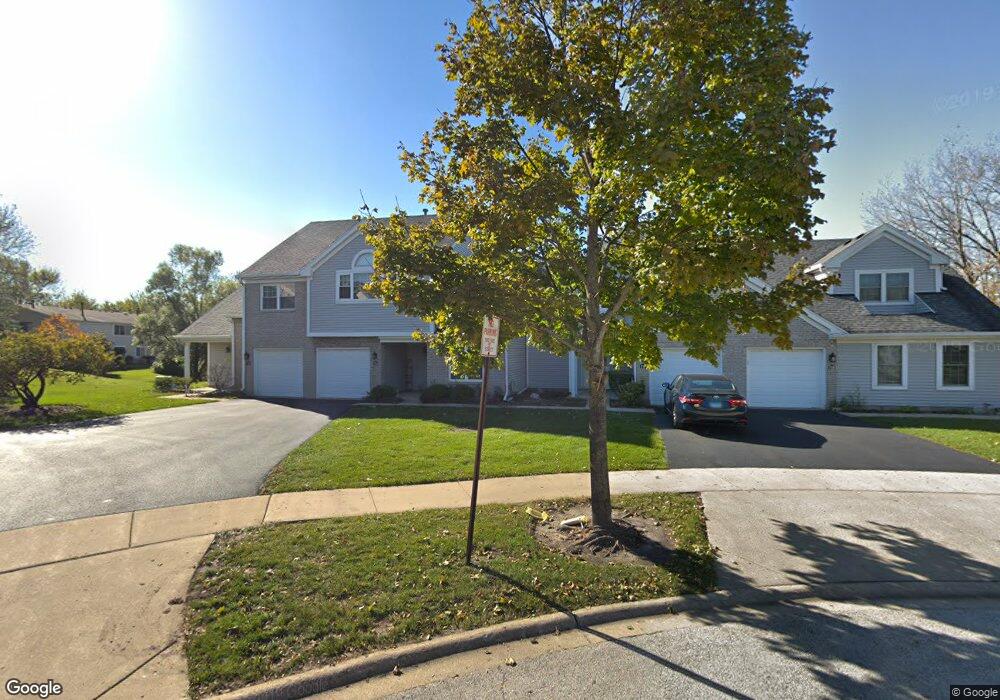
714 Sutton Cir Unit 22 Wheeling, IL 60090
Estimated Value: $302,000 - $315,000
3
Beds
1
Bath
1,400
Sq Ft
$221/Sq Ft
Est. Value
About This Home
This home is located at 714 Sutton Cir Unit 22, Wheeling, IL 60090 and is currently estimated at $308,742, approximately $220 per square foot. 714 Sutton Cir Unit 22 is a home located in Cook County with nearby schools including Eugene Field Elementary School, Jack London Middle School, and Buffalo Grove High School.
Ownership History
Date
Name
Owned For
Owner Type
Purchase Details
Closed on
Apr 28, 2006
Sold by
Vlasov Sergey
Bought by
Young Lim Ok Hyun and Young Kim Hee
Current Estimated Value
Home Financials for this Owner
Home Financials are based on the most recent Mortgage that was taken out on this home.
Original Mortgage
$26,200
Outstanding Balance
$14,915
Interest Rate
6.39%
Mortgage Type
Credit Line Revolving
Estimated Equity
$293,827
Purchase Details
Closed on
Jul 28, 1998
Sold by
Rathje Dorothy L
Bought by
Vlasov Sergey
Home Financials for this Owner
Home Financials are based on the most recent Mortgage that was taken out on this home.
Original Mortgage
$129,200
Interest Rate
7.06%
Create a Home Valuation Report for This Property
The Home Valuation Report is an in-depth analysis detailing your home's value as well as a comparison with similar homes in the area
Home Values in the Area
Average Home Value in this Area
Purchase History
| Date | Buyer | Sale Price | Title Company |
|---|---|---|---|
| Young Lim Ok Hyun | $262,000 | Multiple | |
| Vlasov Sergey | $186,000 | Professional National Title |
Source: Public Records
Mortgage History
| Date | Status | Borrower | Loan Amount |
|---|---|---|---|
| Open | Young Lim Ok Hyun | $26,200 | |
| Open | Young Lim Ok Hyun | $209,600 | |
| Previous Owner | Vlasov Sergey | $129,200 |
Source: Public Records
Tax History
| Year | Tax Paid | Tax Assessment Tax Assessment Total Assessment is a certain percentage of the fair market value that is determined by local assessors to be the total taxable value of land and additions on the property. | Land | Improvement |
|---|---|---|---|---|
| 2025 | $6,684 | $27,716 | $4,250 | $23,466 |
| 2024 | $6,684 | $23,260 | $3,542 | $19,718 |
| 2023 | $6,341 | $23,260 | $3,542 | $19,718 |
| 2022 | $6,341 | $23,260 | $3,542 | $19,718 |
| 2021 | $5,096 | $17,084 | $590 | $16,494 |
| 2020 | $5,045 | $17,084 | $590 | $16,494 |
| 2019 | $5,141 | $19,118 | $590 | $18,528 |
| 2018 | $3,482 | $12,976 | $472 | $12,504 |
| 2017 | $3,191 | $12,976 | $472 | $12,504 |
| 2016 | $3,496 | $12,976 | $472 | $12,504 |
| 2015 | $2,662 | $10,095 | $2,006 | $8,089 |
| 2014 | $2,616 | $10,095 | $2,006 | $8,089 |
| 2013 | $2,396 | $10,095 | $2,006 | $8,089 |
Source: Public Records
Map
Nearby Homes
- 822 Colonial Dr Unit B
- 842 Colonial Dr Unit B
- 813 Valley Stream Dr Unit D
- 271 Northgate Pkwy Unit 1B
- 640 Mchenry Rd Unit 301
- 1052 Southbury Ln Unit 1
- 88 W Wayne Place
- 575 Greystone Ln Unit A2
- 550 Greystone Ln Unit A2
- 1050 Driftwood Ct Unit 1
- 665 Cindy Ln
- 195 7th St
- 1133 Hawthorne Ct Unit A2
- 62 Mayer Ave
- 1168 Northbury Ln Unit 1
- 586 Fairway View Dr Unit 2C
- 586 Fairway View Dr Unit 1A
- 353 E Norman Ln
- 1324 Alpine Ct Unit 104
- 588 Fairway View Dr Unit 2E
- 716 Sutton Cir Unit 23
- 712 Sutton Cir Unit 21
- 718 Sutton Cir Unit 24
- 708 Sutton Cir Unit 14
- 706 Sutton Cir Unit 13
- 704 Sutton Cir Unit 12
- 724 Sutton Cir Unit 32
- 702 Sutton Cir Unit 11
- 726 Sutton Cir Unit 33
- 728 Sutton Cir Unit 34
- 761 Dover Place Unit 3B
- 750 Dover Place Unit 2B
- 763 Dover Place Unit 3D
- 708 Dorset Cir Unit 44
- 757 Dover Place Unit 3A
- 748 Dover Place Unit 2C
- 746 Dover Place Unit 2B
- 759 Dover Place Unit 3C
- 706 Dorset Cir Unit 43
- 744 Dover Place Unit 2D
Your Personal Tour Guide
Ask me questions while you tour the home.