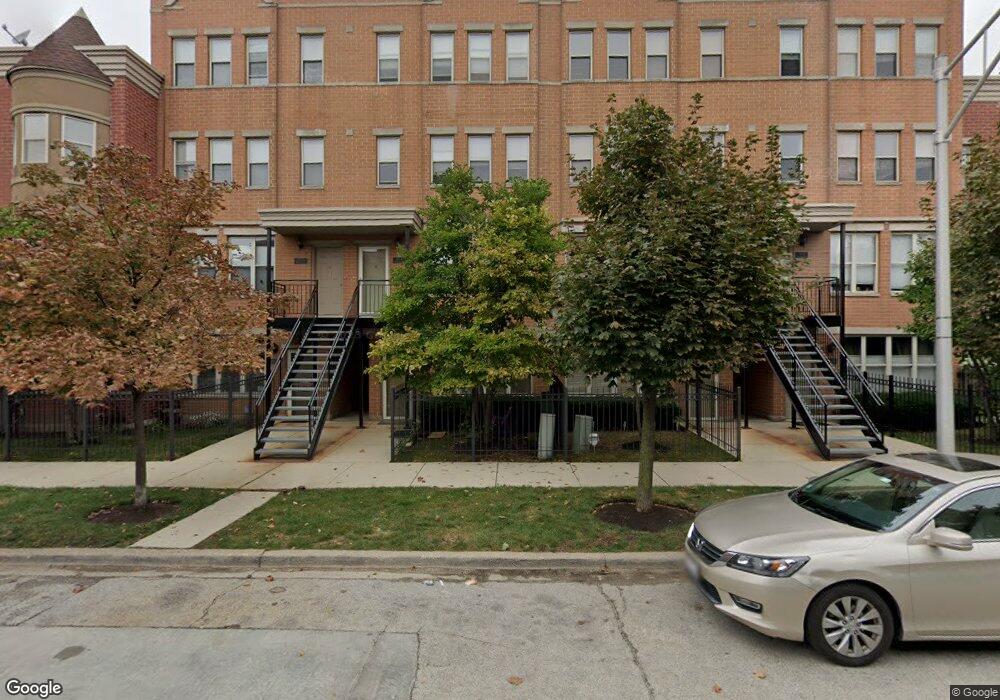
714 W Evergreen Ave Unit 714B Chicago, IL 60610
Goose Island NeighborhoodEstimated Value: $465,000 - $527,000
3
Beds
2
Baths
1,250
Sq Ft
$394/Sq Ft
Est. Value
About This Home
This home is located at 714 W Evergreen Ave Unit 714B, Chicago, IL 60610 and is currently estimated at $493,011, approximately $394 per square foot. 714 W Evergreen Ave Unit 714B is a home located in Cook County with nearby schools including Manierre Elementary School, Lincoln Park High School, and The Noble Academy.
Ownership History
Date
Name
Owned For
Owner Type
Purchase Details
Closed on
Nov 25, 2013
Sold by
Kubicki Kristopher and Kubicki Lalen N
Bought by
Kubicki Kristopher J and Kubicki Lalen N
Current Estimated Value
Purchase Details
Closed on
Jun 27, 2011
Sold by
Jws Charter Special Assets Llc
Bought by
Kubicki Kristopher and Nuth Lalen
Home Financials for this Owner
Home Financials are based on the most recent Mortgage that was taken out on this home.
Original Mortgage
$165,000
Outstanding Balance
$114,156
Interest Rate
4.63%
Mortgage Type
New Conventional
Estimated Equity
$378,855
Purchase Details
Closed on
Mar 7, 2011
Sold by
Yoon Joseph
Bought by
Jws Charter Special Assets Llc
Purchase Details
Closed on
May 24, 2002
Sold by
North Town Village Llc
Bought by
Yoon Joseph
Home Financials for this Owner
Home Financials are based on the most recent Mortgage that was taken out on this home.
Original Mortgage
$215,294
Interest Rate
5.61%
Create a Home Valuation Report for This Property
The Home Valuation Report is an in-depth analysis detailing your home's value as well as a comparison with similar homes in the area
Home Values in the Area
Average Home Value in this Area
Purchase History
| Date | Buyer | Sale Price | Title Company |
|---|---|---|---|
| Kubicki Kristopher J | -- | None Available | |
| Kubicki Kristopher | $220,000 | Ctic | |
| Jws Charter Special Assets Llc | -- | None Available | |
| Yoon Joseph | $269,500 | -- |
Source: Public Records
Mortgage History
| Date | Status | Borrower | Loan Amount |
|---|---|---|---|
| Open | Kubicki Kristopher | $165,000 | |
| Previous Owner | Yoon Joseph | $215,294 |
Source: Public Records
Tax History Compared to Growth
Tax History
| Year | Tax Paid | Tax Assessment Tax Assessment Total Assessment is a certain percentage of the fair market value that is determined by local assessors to be the total taxable value of land and additions on the property. | Land | Improvement |
|---|---|---|---|---|
| 2024 | $8,048 | $42,381 | $21,088 | $21,293 |
| 2023 | $7,846 | $38,147 | $17,178 | $20,969 |
| 2022 | $7,846 | $38,147 | $17,178 | $20,969 |
| 2021 | $7,671 | $38,146 | $17,177 | $20,969 |
| 2020 | $7,413 | $33,276 | $16,326 | $16,950 |
| 2019 | $7,290 | $36,284 | $16,326 | $19,958 |
| 2018 | $7,167 | $36,284 | $16,326 | $19,958 |
| 2017 | $5,951 | $27,645 | $12,924 | $14,721 |
| 2016 | $5,537 | $27,645 | $12,924 | $14,721 |
| 2015 | $5,066 | $27,645 | $12,924 | $14,721 |
| 2014 | $3,412 | $18,392 | $9,795 | $8,597 |
| 2013 | $3,345 | $18,392 | $9,795 | $8,597 |
Source: Public Records
Map
Nearby Homes
- 1333 N Burling St Unit B
- 1317 N Larrabee St Unit 305
- 1317 N Larrabee St Unit 304
- 860 W Blackhawk St Unit 2106
- 860 W Blackhawk St Unit 303
- 860 W Blackhawk St Unit 306
- 860 W Blackhawk St Unit 204
- 860 W Blackhawk St Unit 805
- 1414 N Mohawk St
- 1428 N Mohawk St Unit A
- 1329 N Mohawk St Unit 1
- 1310 N Cleveland Ave Unit 3
- 1625 N Burling St Unit 401
- 1625 N Burling St Unit 302
- 511 W Division St Unit 607
- 1623 N Halsted St
- 1625 N Halsted St
- 1629 N Halsted St
- 1631 N Halsted St
- 1615 N Vine St
- 714 W Evergreen Ave Unit 714A
- 714 W Evergreen Ave
- 714 W Evergreen Ave Unit B
- 714 W Evergreen Ave Unit A
- 716 W Evergreen Ave Unit 716A
- 716 W Evergreen Ave Unit 716B
- 716 W Evergreen Ave Unit A
- 712 W Evergreen Ave Unit 712B
- 712 W Evergreen Ave Unit 712A
- 712 W Evergreen Ave Unit A
- 718 W Evergreen Ave Unit 718A
- 718 W Evergreen Ave Unit 718B
- 718 W Evergreen Ave Unit A
- 710 W Evergreen Ave Unit 710A
- 710 W Evergreen Ave Unit A
- 720 W Evergreen Ave Unit 720A
- 720 W Evergreen Ave Unit 722A
- 720 W Evergreen Ave Unit TNWH
- 720 W Evergreen Ave
- 720 W Evergreen Ave