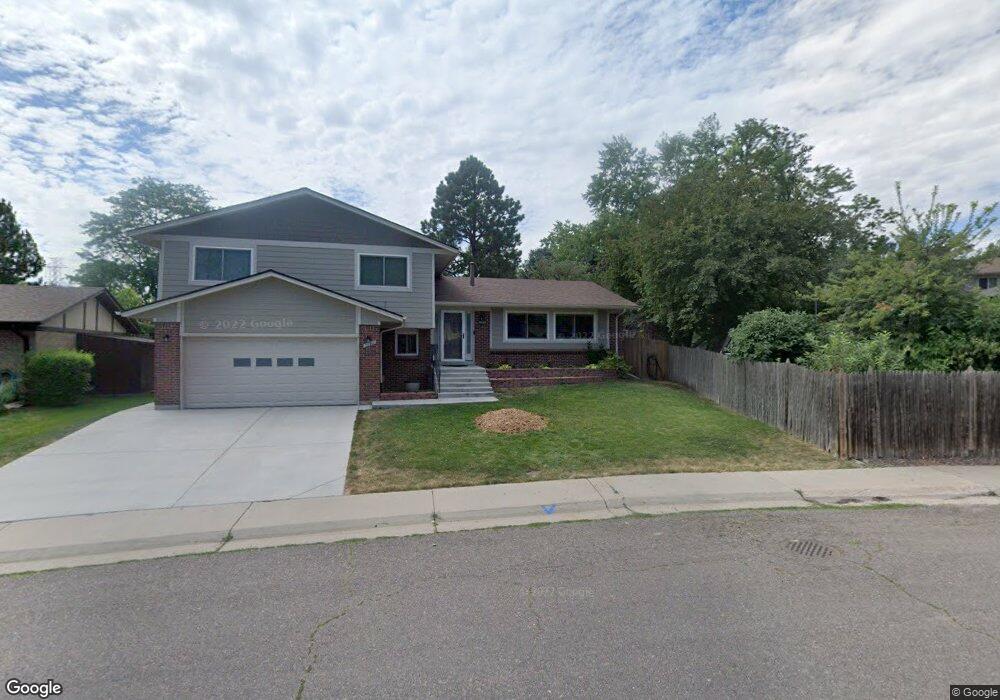
7140 E Iliff Ave Denver, CO 80224
Goldsmith NeighborhoodEstimated Value: $649,000 - $767,000
4
Beds
3
Baths
1,508
Sq Ft
$472/Sq Ft
Est. Value
About This Home
This home is located at 7140 E Iliff Ave, Denver, CO 80224 and is currently estimated at $711,637, approximately $471 per square foot. 7140 E Iliff Ave is a home located in Denver County with nearby schools including Holm Elementary School, Samuels Elementary School, and Joe Shoemaker School.
Ownership History
Date
Name
Owned For
Owner Type
Purchase Details
Closed on
Jun 8, 2016
Sold by
Robert B Vlier Trust
Bought by
Vlier Jeffrey S and Vlier Julie A
Current Estimated Value
Home Financials for this Owner
Home Financials are based on the most recent Mortgage that was taken out on this home.
Original Mortgage
$232,000
Outstanding Balance
$183,186
Interest Rate
3.66%
Mortgage Type
New Conventional
Estimated Equity
$528,451
Purchase Details
Closed on
Feb 15, 2008
Sold by
Vlier Robert B
Bought by
Robert B Vlier Trust
Purchase Details
Closed on
Jul 14, 2004
Sold by
Vlier Dee A
Bought by
Vlier Dee A and Vlier Jeffrey S
Home Financials for this Owner
Home Financials are based on the most recent Mortgage that was taken out on this home.
Original Mortgage
$123,241
Interest Rate
5.87%
Mortgage Type
Seller Take Back
Purchase Details
Closed on
Feb 7, 2001
Sold by
Martin Oscar E
Bought by
Vlier Dee A
Create a Home Valuation Report for This Property
The Home Valuation Report is an in-depth analysis detailing your home's value as well as a comparison with similar homes in the area
Home Values in the Area
Average Home Value in this Area
Purchase History
| Date | Buyer | Sale Price | Title Company |
|---|---|---|---|
| Vlier Jeffrey S | -- | None Available | |
| Robert B Vlier Trust | -- | None Available | |
| Vlier Dee A | $123,241 | Fahtco | |
| Vlier Dee A | $240,500 | Land Title |
Source: Public Records
Mortgage History
| Date | Status | Borrower | Loan Amount |
|---|---|---|---|
| Open | Vlier Jeffrey S | $232,000 | |
| Previous Owner | Vlier Dee A | $123,241 |
Source: Public Records
Tax History
| Year | Tax Paid | Tax Assessment Tax Assessment Total Assessment is a certain percentage of the fair market value that is determined by local assessors to be the total taxable value of land and additions on the property. | Land | Improvement |
|---|---|---|---|---|
| 2025 | $3,441 | $48,290 | $14,100 | $14,100 |
| 2024 | $3,441 | $43,450 | $9,720 | $33,730 |
| 2023 | $3,367 | $43,450 | $9,720 | $33,730 |
| 2022 | $2,806 | $35,290 | $13,900 | $21,390 |
| 2021 | $2,709 | $36,310 | $14,300 | $22,010 |
| 2020 | $2,270 | $30,600 | $14,300 | $16,300 |
| 2019 | $2,207 | $30,600 | $14,300 | $16,300 |
| 2018 | $2,154 | $27,840 | $10,800 | $17,040 |
| 2017 | $2,147 | $27,840 | $10,800 | $17,040 |
| 2016 | $2,053 | $25,170 | $8,756 | $16,414 |
| 2015 | $1,966 | $25,170 | $8,756 | $16,414 |
| 2014 | $1,705 | $20,530 | $7,076 | $13,454 |
Source: Public Records
Map
Nearby Homes
- 6776 E Panorama Ln Unit C-3
- 1956 S Poplar St
- 1971 S Poplar Ct
- 1934 S Poplar Ct
- 1930 S Newport St
- 2396 S Linden Ct
- 2375 S Linden Ct Unit 201A
- 2375 S Linden Ct Unit A313
- 2375 S Linden Ct Unit AA100
- 2427 S Kirkwood Ct
- 2575 S Syracuse Way Unit H201
- 2575 S Syracuse Way Unit M108
- 2575 S Syracuse Way Unit G104
- 2575 S Syracuse Way Unit B107
- 2575 S Syracuse Way Unit EE205
- 2575 S Syracuse Way Unit L103
- 2575 S Syracuse Way Unit M206
- 2575 S Syracuse Way Unit M306
- 2575 S Syracuse Way Unit K201
- 2575 S Syracuse Way Unit J102
- 2300 S Pontiac St
- 2211 S Poplar St
- 7165 E Iliff Ave
- 2320 S Pontiac St
- 2201 S Poplar St
- 2330 S Pontiac St
- 7135 E Iliff Ave
- 23302 S Pontiac St
- 2221 S Poplar St
- 7105 E Iliff Ave
- 7183 E Warren Dr
- 7173 E Warren Dr
- 2340 S Pontiac St
- 7163 E Warren Dr
- 2305 S Pontiac St
- 2231 S Poplar St
- 7095 E Iliff Ave
- 2317 S Pontiac St
- 7144 E Warren Dr
- 7153 E Warren Dr
Your Personal Tour Guide
Ask me questions while you tour the home.