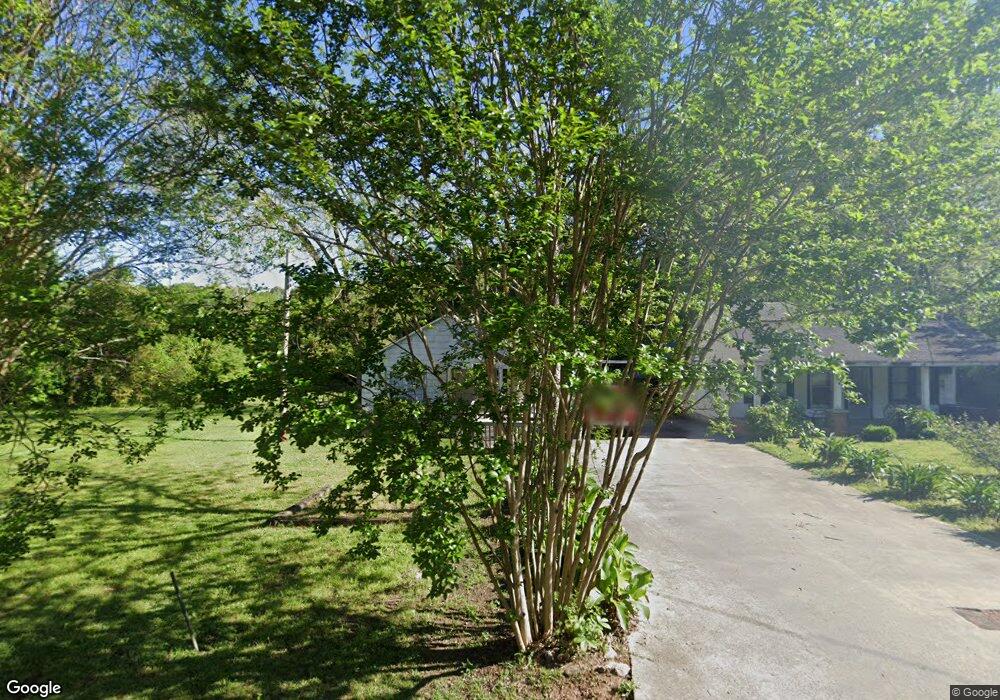
7143 Midway Dr SW Covington, GA 30014
Estimated Value: $153,000 - $263,000
--
Bed
--
Bath
1,412
Sq Ft
$145/Sq Ft
Est. Value
About This Home
This home is located at 7143 Midway Dr SW, Covington, GA 30014 and is currently estimated at $204,667, approximately $144 per square foot. 7143 Midway Dr SW is a home with nearby schools including Porterdale Elementary School, Clements Middle School, and Eastside High School.
Ownership History
Date
Name
Owned For
Owner Type
Purchase Details
Closed on
Aug 14, 2023
Sold by
Mcculough Christy L
Bought by
Mccullough Walker Christy L
Current Estimated Value
Purchase Details
Closed on
Jun 8, 2023
Sold by
Mccullough Tiffany
Bought by
Mccullough Christy L
Purchase Details
Closed on
May 16, 2023
Sold by
Mccullough James David
Bought by
Mccullough Christy L
Purchase Details
Closed on
Jan 9, 2023
Sold by
Sheppard Megan
Bought by
Mccullough Christy L
Purchase Details
Closed on
Dec 5, 2022
Sold by
Mccullough Ryan
Bought by
Mccullough Christy L
Purchase Details
Closed on
Nov 14, 2022
Sold by
Mccullough Bruce
Bought by
Mccullough Christy L
Purchase Details
Closed on
Oct 24, 2022
Sold by
Mccullough Jason
Bought by
Mccullough Christy L
Purchase Details
Closed on
Oct 17, 2022
Sold by
Woodruff Deborah M
Bought by
Mccullough Christy L
Purchase Details
Closed on
Jul 15, 2022
Sold by
Lewis Diane Mccullough Thom
Bought by
Mccullough Christy L
Create a Home Valuation Report for This Property
The Home Valuation Report is an in-depth analysis detailing your home's value as well as a comparison with similar homes in the area
Home Values in the Area
Average Home Value in this Area
Purchase History
| Date | Buyer | Sale Price | Title Company |
|---|---|---|---|
| Mccullough Walker Christy L | -- | -- | |
| Mccullough Christy L | -- | -- | |
| Mccullough Christy L | -- | -- | |
| Mccullough Christy L | -- | -- | |
| Mccullough Christy L | -- | -- | |
| Mccullough Christy L | -- | -- | |
| Mccullough Christy L | -- | -- | |
| Mccullough Christy L | -- | -- | |
| Mccullough Christy L | -- | -- |
Source: Public Records
Tax History Compared to Growth
Tax History
| Year | Tax Paid | Tax Assessment Tax Assessment Total Assessment is a certain percentage of the fair market value that is determined by local assessors to be the total taxable value of land and additions on the property. | Land | Improvement |
|---|---|---|---|---|
| 2024 | $435 | $14,400 | $2,022 | $12,378 |
| 2023 | $547 | $14,400 | $3,420 | $10,980 |
| 2022 | $221 | $6,800 | $2,714 | $4,086 |
| 2021 | $420 | $11,560 | $6,595 | $4,965 |
| 2020 | $461 | $11,560 | $6,800 | $4,760 |
| 2019 | $450 | $11,080 | $6,800 | $4,280 |
| 2018 | $291 | $7,080 | $4,800 | $2,280 |
| 2017 | $238 | $5,800 | $3,600 | $2,200 |
| 2016 | $245 | $5,960 | $2,800 | $3,160 |
| 2015 | $245 | $5,960 | $2,000 | $3,960 |
| 2014 | $201 | $6,240 | $0 | $0 |
Source: Public Records
Map
Nearby Homes
- 5160 Avery St SW
- 7205 Lakeview Dr SW
- 163 Kingfisher Walk
- 7619 Saffron Ave
- 7641 Saffron Ave
- 7620 Saffron Ave
- 7624 Saffron Ave
- 7630 Saffron Ave
- 7651 Saffron Ave
- 7636 Saffron Ave
- 7661 Saffron Ave
- Copernicus Plan at Ashford Park
- Radiance Plan at Ashford Park
- Beacon Plan at Ashford Park
- Galileo Plan at Ashford Park
- Solstice Plan at Ashford Park
- Spectra Plan at Ashford Park
- Supernova Plan at Ashford Park
- 7776 Sudbury Cir
- 7662 Saffron Ave
- 7137 Midway Dr SW
- 7149 Midway Dr SW
- 7144 Midway Dr SW
- 7142 Midway Dr SW
- 7136 Midway Dr SW
- 7155 Midway Dr SW
- 7156 Midway Dr SW
- 6187 Washington St SW
- 7159 Midway Dr SW
- 7162 Midway Dr SW
- 7167 Midway Dr SW
- 7168 Midway Dr SW
- 6181 Washington St SW
- 7177 Midway Dr SW
- 7176 Midway Dr SW
- 6175 Washington St SW
- 6163 Washington St SW
- 0 Washington St SW
- 0 Washington St SW Unit 10065919
- 0 Washington St SW Unit 10065917