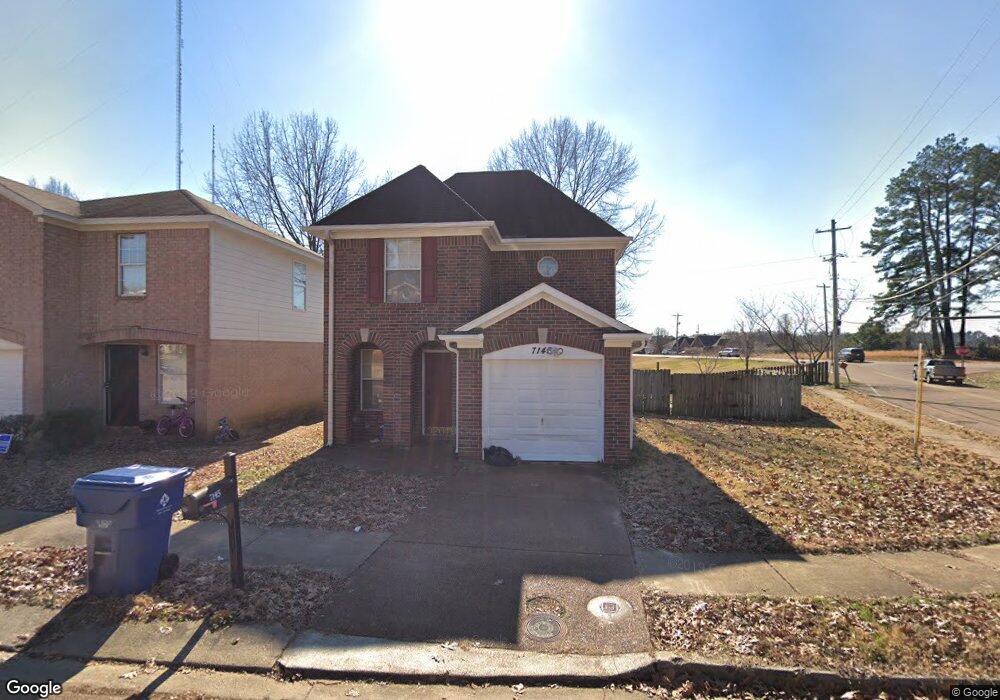
7145 Charlton Way Cordova, TN 38018
Cordova NeighborhoodEstimated Value: $251,746 - $260,000
3
Beds
2
Baths
2,225
Sq Ft
$114/Sq Ft
Est. Value
About This Home
This home is located at 7145 Charlton Way, Cordova, TN 38018 and is currently estimated at $253,937, approximately $114 per square foot. 7145 Charlton Way is a home located in Shelby County with nearby schools including Dexter Elementary School, Dexter Middle School, and Cordova High School.
Ownership History
Date
Name
Owned For
Owner Type
Purchase Details
Closed on
Jul 19, 2006
Sold by
Deutsche Bank National Trust Co
Bought by
Chow King
Current Estimated Value
Purchase Details
Closed on
Jan 26, 2006
Sold by
Menard Paul D and Menard Rachel L
Bought by
Deutsche Bank National Trust Co
Purchase Details
Closed on
Feb 10, 2005
Sold by
Hawkins Reola and Hayslett Chasity
Bought by
Menard Paul D and Menard Rachel L
Home Financials for this Owner
Home Financials are based on the most recent Mortgage that was taken out on this home.
Original Mortgage
$87,120
Interest Rate
6.5%
Mortgage Type
Purchase Money Mortgage
Purchase Details
Closed on
Nov 30, 2001
Sold by
Lagonia Holdings Llc
Bought by
Hawkins Reola and Hayslett Chasity
Home Financials for this Owner
Home Financials are based on the most recent Mortgage that was taken out on this home.
Original Mortgage
$109,931
Interest Rate
6.6%
Create a Home Valuation Report for This Property
The Home Valuation Report is an in-depth analysis detailing your home's value as well as a comparison with similar homes in the area
Home Values in the Area
Average Home Value in this Area
Purchase History
| Date | Buyer | Sale Price | Title Company |
|---|---|---|---|
| Chow King | $89,500 | Realty Title & Escrow Co Inc | |
| Deutsche Bank National Trust Co | $91,630 | None Available | |
| Menard Paul D | $108,900 | -- | |
| Hawkins Reola | $110,800 | Southern Escrow Title Compan |
Source: Public Records
Mortgage History
| Date | Status | Borrower | Loan Amount |
|---|---|---|---|
| Previous Owner | Menard Paul D | $87,120 | |
| Previous Owner | Hawkins Reola | $109,931 | |
| Closed | Menard Paul D | $21,780 |
Source: Public Records
Tax History Compared to Growth
Tax History
| Year | Tax Paid | Tax Assessment Tax Assessment Total Assessment is a certain percentage of the fair market value that is determined by local assessors to be the total taxable value of land and additions on the property. | Land | Improvement |
|---|---|---|---|---|
| 2025 | $1,426 | $60,850 | $6,250 | $54,600 |
| 2024 | -- | $42,075 | $5,325 | $36,750 |
| 2023 | $1,426 | $42,075 | $5,325 | $36,750 |
| 2022 | $1,426 | $42,075 | $5,325 | $36,750 |
| 2021 | $1,452 | $42,075 | $5,325 | $36,750 |
| 2020 | $1,250 | $30,875 | $5,325 | $25,550 |
| 2019 | $1,250 | $30,875 | $5,325 | $25,550 |
| 2018 | $1,250 | $30,875 | $5,325 | $25,550 |
| 2017 | $1,269 | $30,875 | $5,325 | $25,550 |
| 2016 | $1,419 | $32,475 | $0 | $0 |
| 2014 | $1,419 | $32,475 | $0 | $0 |
Source: Public Records
Map
Nearby Homes
- 7194 Charlton Way
- 1382 Exbury Dr
- 6884 Wrigley Dr
- 6880 Wrigley Dr
- 6890 Century Oaks Dr
- 1089 Links View Ln W
- 7035 S Estacada Way
- 7247 Winterbrook Ln
- 6840 Kamali Ave
- 7468 Links View Ln S
- 7303 Winterbrook Ln
- 6916 Lagrange Pines Rd
- 7494 Links View Ln S
- 6838 Lagrange Cir N
- 6774 Whitten Pine Dr
- 1321 Winter Springs Ln
- 7412 Lost Trail Dr
- 7420 Dal Whinnie Trail
- 887 Dalemore Ln
- 1277 Winter Springs Ln
- 7149 Charlton Way
- 7153 Charlton Way
- 7157 Charlton Way
- 1158 Charles Bryan Rd
- 7161 Charlton Way
- 7154 Charlton Way
- 7165 Charlton Way
- 7150 Charlton Way
- 7154 Charlton Way
- 7169 Charlton Way
- 7158 Charlton Way
- 7162 Charlton Way
- 7173 Charlton Way
- 7166 Charlton Way
- 7177 Charlton Way
- 7170 Charlton Way
- 7134 Raleigh Lagrange Rd
- 7181 Charlton Way
- 7174 Charlton Way
- 7178 Charlton Way