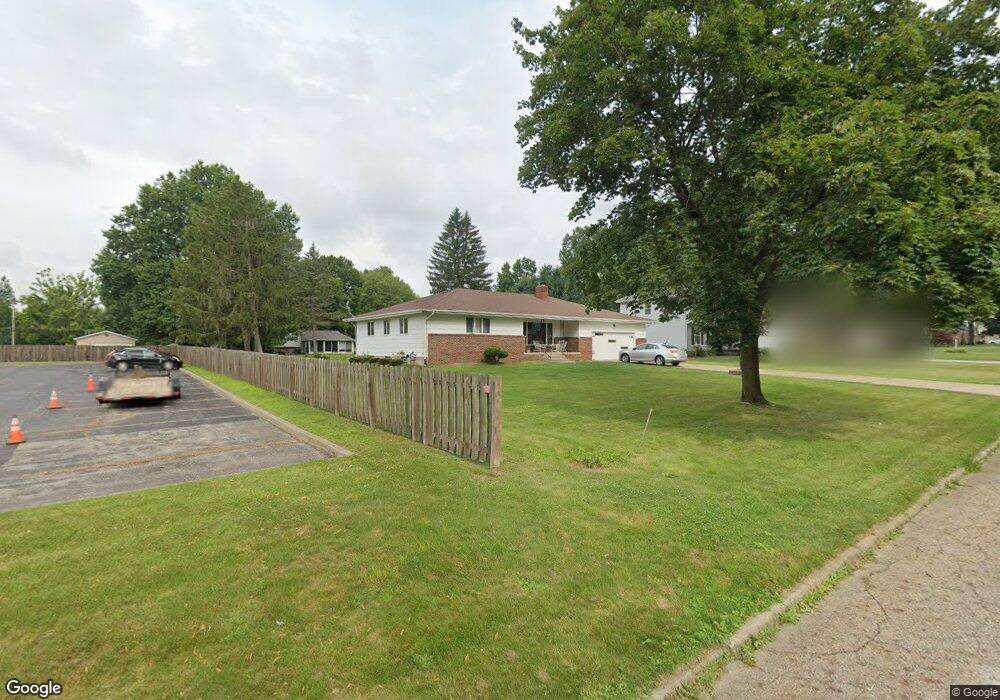
7148 Ron Park Place Youngstown, OH 44512
Estimated Value: $257,059 - $286,000
3
Beds
2
Baths
1,674
Sq Ft
$164/Sq Ft
Est. Value
About This Home
This home is located at 7148 Ron Park Place, Youngstown, OH 44512 and is currently estimated at $274,765, approximately $164 per square foot. 7148 Ron Park Place is a home located in Mahoning County with nearby schools including West Boulevard Elementary School, Boardman Center Middle School, and Boardman High School.
Ownership History
Date
Name
Owned For
Owner Type
Purchase Details
Closed on
Nov 29, 2007
Sold by
Thomas David H and Anania Betty Jean
Bought by
Collins Thomas and Collins Cerelina P
Current Estimated Value
Home Financials for this Owner
Home Financials are based on the most recent Mortgage that was taken out on this home.
Original Mortgage
$96,000
Outstanding Balance
$60,858
Interest Rate
6.33%
Mortgage Type
Purchase Money Mortgage
Estimated Equity
$213,907
Purchase Details
Closed on
Nov 20, 2007
Sold by
Anania Betty Jean and Anania Peter J
Bought by
Anania Betty Jean and Bennett Nancy Lee
Home Financials for this Owner
Home Financials are based on the most recent Mortgage that was taken out on this home.
Original Mortgage
$96,000
Outstanding Balance
$60,858
Interest Rate
6.33%
Mortgage Type
Purchase Money Mortgage
Estimated Equity
$213,907
Purchase Details
Closed on
Oct 23, 2001
Sold by
Antonietta Ferrelli
Bought by
Thomas Nina and Anania Betty Jean
Purchase Details
Closed on
Jul 28, 1967
Bought by
Ferrelli Frank
Create a Home Valuation Report for This Property
The Home Valuation Report is an in-depth analysis detailing your home's value as well as a comparison with similar homes in the area
Home Values in the Area
Average Home Value in this Area
Purchase History
| Date | Buyer | Sale Price | Title Company |
|---|---|---|---|
| Collins Thomas | $120,000 | Safeguard Title Agency | |
| Anania Betty Jean | -- | Attorney | |
| Thomas Nina | -- | -- | |
| Ferrelli Frank | -- | -- |
Source: Public Records
Mortgage History
| Date | Status | Borrower | Loan Amount |
|---|---|---|---|
| Open | Collins Thomas | $96,000 |
Source: Public Records
Tax History Compared to Growth
Tax History
| Year | Tax Paid | Tax Assessment Tax Assessment Total Assessment is a certain percentage of the fair market value that is determined by local assessors to be the total taxable value of land and additions on the property. | Land | Improvement |
|---|---|---|---|---|
| 2024 | $3,871 | $74,620 | $9,220 | $65,400 |
| 2023 | $3,820 | $74,620 | $9,220 | $65,400 |
| 2022 | $3,230 | $48,180 | $9,200 | $38,980 |
| 2021 | $3,233 | $48,180 | $9,200 | $38,980 |
| 2020 | $3,249 | $48,180 | $9,200 | $38,980 |
| 2019 | $3,314 | $43,810 | $8,370 | $35,440 |
| 2018 | $2,807 | $43,810 | $8,370 | $35,440 |
| 2017 | $2,732 | $43,810 | $8,370 | $35,440 |
| 2016 | $2,675 | $41,610 | $9,290 | $32,320 |
| 2015 | $2,622 | $41,610 | $9,290 | $32,320 |
| 2014 | $2,630 | $41,610 | $9,290 | $32,320 |
| 2013 | $2,596 | $41,610 | $9,290 | $32,320 |
Source: Public Records
Map
Nearby Homes
- 6938 Ron Park Place
- 0 Pinewood Dr Unit 5140025
- 6632 Harrington Ave
- 813 Brookfield Ave
- 7544 Jaguar Dr
- 7556 Jaguar Dr
- 772 Ewing Rd
- 7511 E Parkside Dr
- 396 Brookfield Ave
- 6892 Glenwood Ave
- 768 Crestview Dr
- 715 Crestview Dr
- 7603 Red Fox Dr
- 7005 Paxton Rd
- 7367 Oregon Trail
- 7716 Silver Fox Dr
- 7387 Oregon Trail
- 1193 Red Tail Hawk Ct Unit 1
- 242 Oakley Ave
- 7692 W Parkside Dr
- 7130 Ron Park Place
- 7122 Ron Park Place
- 7171 Ronjoy Place
- 7129 Ronjoy Place
- 7151 Ron Park Place
- 7121 Ronjoy Place
- 810 Ron Park Place
- 7114 Ron Park Place
- 7131 Ron Park Place
- 7123 Ron Park Place
- 7113 Ronjoy Place
- 7106 Ron Park Place
- 7115 Ron Park Place
- 7105 Ronjoy Place
- 7172 Ronjoy Place
- 7208 Ronjoy Place
- 7128 Ronjoy Place
- 7002 Ron Park Place
- 7018 Ronjoy Place
- 7107 Ron Park Place