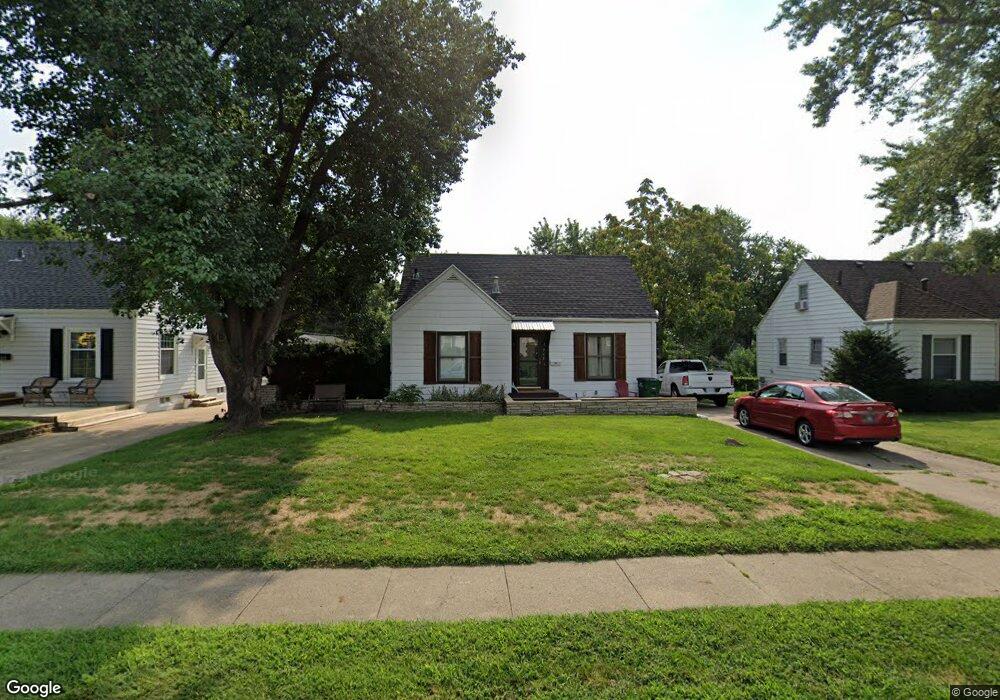
715 10th St West Des Moines, IA 50265
Estimated Value: $254,000 - $274,283
4
Beds
1
Bath
1,653
Sq Ft
$161/Sq Ft
Est. Value
About This Home
This home is located at 715 10th St, West Des Moines, IA 50265 and is currently estimated at $266,571, approximately $161 per square foot. 715 10th St is a home located in Polk County with nearby schools including Hillside Elementary School, Stilwell Junior High School, and Valley Southwoods Freshman High School.
Ownership History
Date
Name
Owned For
Owner Type
Purchase Details
Closed on
Mar 6, 2017
Sold by
Redmond Albert P
Bought by
Redmond Albert P and Redmond Cody W
Current Estimated Value
Purchase Details
Closed on
Feb 18, 2003
Sold by
Westerbeck Kent E and Waltersheide Marcia M
Bought by
Redmond Albert P
Create a Home Valuation Report for This Property
The Home Valuation Report is an in-depth analysis detailing your home's value as well as a comparison with similar homes in the area
Home Values in the Area
Average Home Value in this Area
Purchase History
| Date | Buyer | Sale Price | Title Company |
|---|---|---|---|
| Redmond Albert P | -- | None Available | |
| Redmond Albert P | $123,500 | -- |
Source: Public Records
Tax History Compared to Growth
Tax History
| Year | Tax Paid | Tax Assessment Tax Assessment Total Assessment is a certain percentage of the fair market value that is determined by local assessors to be the total taxable value of land and additions on the property. | Land | Improvement |
|---|---|---|---|---|
| 2025 | $3,508 | $257,500 | $70,900 | $186,600 |
| 2024 | $3,508 | $237,100 | $64,500 | $172,600 |
| 2023 | $3,630 | $237,100 | $64,500 | $172,600 |
| 2022 | $3,422 | $196,900 | $55,700 | $141,200 |
| 2021 | $3,358 | $196,900 | $55,700 | $141,200 |
| 2020 | $3,304 | $179,900 | $50,600 | $129,300 |
| 2019 | $3,120 | $179,900 | $50,600 | $129,300 |
| 2018 | $3,122 | $160,800 | $44,400 | $116,400 |
| 2017 | $2,984 | $160,800 | $44,400 | $116,400 |
| 2016 | $2,916 | $149,700 | $40,700 | $109,000 |
| 2015 | $2,916 | $149,700 | $40,700 | $109,000 |
| 2014 | $2,796 | $142,400 | $38,000 | $104,400 |
Source: Public Records
Map
Nearby Homes