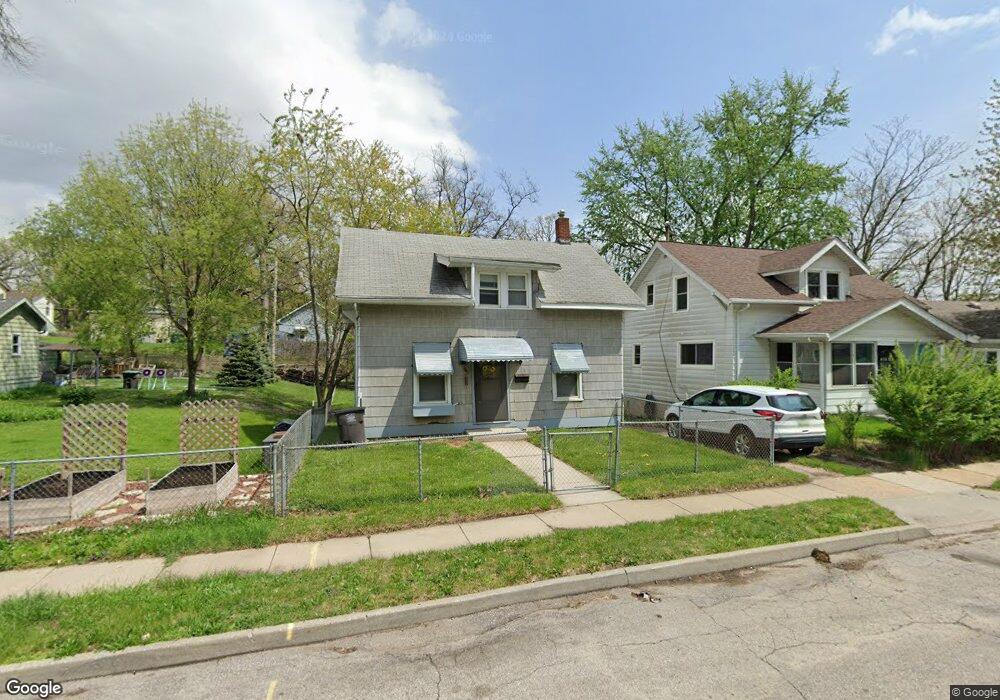
715 25th St Des Moines, IA 50312
Woodland Heights NeighborhoodEstimated Value: $155,000 - $172,000
2
Beds
1
Bath
1,042
Sq Ft
$155/Sq Ft
Est. Value
About This Home
This home is located at 715 25th St, Des Moines, IA 50312 and is currently estimated at $161,512, approximately $155 per square foot. 715 25th St is a home located in Polk County with nearby schools including Greenwood Elementary School and Roosevelt High School.
Ownership History
Date
Name
Owned For
Owner Type
Purchase Details
Closed on
Jan 4, 2010
Sold by
Citifinancial Inc
Bought by
Third Llc
Current Estimated Value
Purchase Details
Closed on
Jul 16, 2005
Sold by
Thomas Edna B and Pargo Mary L
Bought by
Thomas Edna B
Home Financials for this Owner
Home Financials are based on the most recent Mortgage that was taken out on this home.
Original Mortgage
$54,600
Interest Rate
8.87%
Mortgage Type
Fannie Mae Freddie Mac
Purchase Details
Closed on
Jul 6, 2004
Sold by
Allen Mavin W
Bought by
Thomas Edna B and Pargo Mary L
Create a Home Valuation Report for This Property
The Home Valuation Report is an in-depth analysis detailing your home's value as well as a comparison with similar homes in the area
Home Values in the Area
Average Home Value in this Area
Purchase History
| Date | Buyer | Sale Price | Title Company |
|---|---|---|---|
| Third Llc | $32,000 | None Available | |
| Thomas Edna B | $500 | Title Direct | |
| Thomas Edna B | -- | -- |
Source: Public Records
Mortgage History
| Date | Status | Borrower | Loan Amount |
|---|---|---|---|
| Previous Owner | Thomas Edna B | $54,600 |
Source: Public Records
Tax History Compared to Growth
Tax History
| Year | Tax Paid | Tax Assessment Tax Assessment Total Assessment is a certain percentage of the fair market value that is determined by local assessors to be the total taxable value of land and additions on the property. | Land | Improvement |
|---|---|---|---|---|
| 2025 | $2,296 | $131,800 | $27,600 | $104,200 |
| 2024 | $2,296 | $116,700 | $24,300 | $92,400 |
| 2023 | $2,188 | $116,700 | $24,300 | $92,400 |
| 2022 | $2,170 | $92,800 | $19,800 | $73,000 |
| 2021 | $2,056 | $92,800 | $19,800 | $73,000 |
| 2020 | $2,136 | $82,400 | $17,700 | $64,700 |
| 2019 | $1,946 | $82,400 | $17,700 | $64,700 |
| 2018 | $1,926 | $72,400 | $15,400 | $57,000 |
| 2017 | $1,866 | $72,400 | $15,400 | $57,000 |
| 2016 | $1,818 | $69,000 | $14,600 | $54,400 |
| 2015 | $1,818 | $69,000 | $14,600 | $54,400 |
| 2014 | $1,600 | $62,500 | $13,200 | $49,300 |
Source: Public Records
Map
Nearby Homes