715 4th St Lawrenceburg, TN 38464
Estimated Value: $238,972 - $301,000
--
Bed
2
Baths
2,055
Sq Ft
$135/Sq Ft
Est. Value
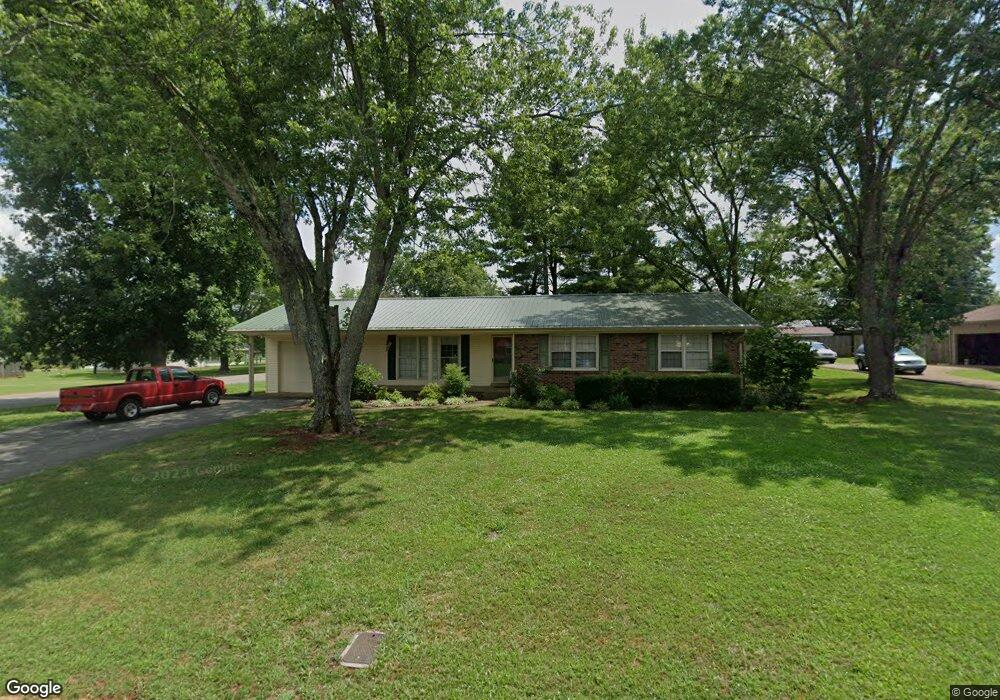
About This Home
This home is located at 715 4th St, Lawrenceburg, TN 38464 and is currently estimated at $277,743, approximately $135 per square foot. 715 4th St is a home located in Lawrence County with nearby schools including Ingram Sowell Elementary School, Lawrenceburg Public Elementary School, and David Crockett Elementary School.
Ownership History
Date
Name
Owned For
Owner Type
Purchase Details
Closed on
Mar 31, 2010
Sold by
Scott Mary L
Bought by
Cox Archie
Current Estimated Value
Purchase Details
Closed on
Oct 3, 2008
Sold by
Sexton Jason
Bought by
Scott Mary L
Home Financials for this Owner
Home Financials are based on the most recent Mortgage that was taken out on this home.
Original Mortgage
$88,000
Interest Rate
6.34%
Purchase Details
Closed on
Feb 3, 2006
Sold by
Katherine Neese Teresa
Bought by
Jason Sexton
Home Financials for this Owner
Home Financials are based on the most recent Mortgage that was taken out on this home.
Original Mortgage
$19,500
Interest Rate
6.14%
Purchase Details
Closed on
Feb 17, 2005
Bought by
Neese Teresa Katherine
Purchase Details
Closed on
Jul 27, 1989
Bought by
Robins Thomas Edward and Robins Teresa
Purchase Details
Closed on
Oct 16, 1978
Bought by
Mattox Dennis and Mattox Barbara
Create a Home Valuation Report for This Property
The Home Valuation Report is an in-depth analysis detailing your home's value as well as a comparison with similar homes in the area
Home Values in the Area
Average Home Value in this Area
Purchase History
| Date | Buyer | Sale Price | Title Company |
|---|---|---|---|
| Cox Archie | $110,000 | -- | |
| Scott Mary L | $110,000 | -- | |
| Jason Sexton | $97,500 | -- | |
| Neese Teresa Katherine | -- | -- | |
| Robins Thomas Edward | -- | -- | |
| Mattox Dennis | -- | -- |
Source: Public Records
Mortgage History
| Date | Status | Borrower | Loan Amount |
|---|---|---|---|
| Previous Owner | Mattox Dennis | $88,000 | |
| Previous Owner | Mattox Dennis | $19,500 |
Source: Public Records
Tax History Compared to Growth
Tax History
| Year | Tax Paid | Tax Assessment Tax Assessment Total Assessment is a certain percentage of the fair market value that is determined by local assessors to be the total taxable value of land and additions on the property. | Land | Improvement |
|---|---|---|---|---|
| 2025 | $1,547 | $49,775 | $0 | $0 |
| 2024 | $1,547 | $49,775 | $4,000 | $45,775 |
| 2023 | $1,547 | $49,775 | $4,000 | $45,775 |
| 2022 | $1,547 | $49,775 | $4,000 | $45,775 |
| 2021 | $1,304 | $29,675 | $2,750 | $26,925 |
| 2020 | $1,304 | $29,675 | $2,750 | $26,925 |
| 2019 | $1,304 | $29,675 | $2,750 | $26,925 |
| 2018 | $1,304 | $29,675 | $2,750 | $26,925 |
| 2017 | $1,304 | $29,675 | $2,750 | $26,925 |
| 2016 | $1,304 | $29,675 | $2,750 | $26,925 |
| 2015 | $1,235 | $29,675 | $2,750 | $26,925 |
| 2014 | $1,166 | $28,025 | $2,750 | $25,275 |
Source: Public Records
Map
Nearby Homes