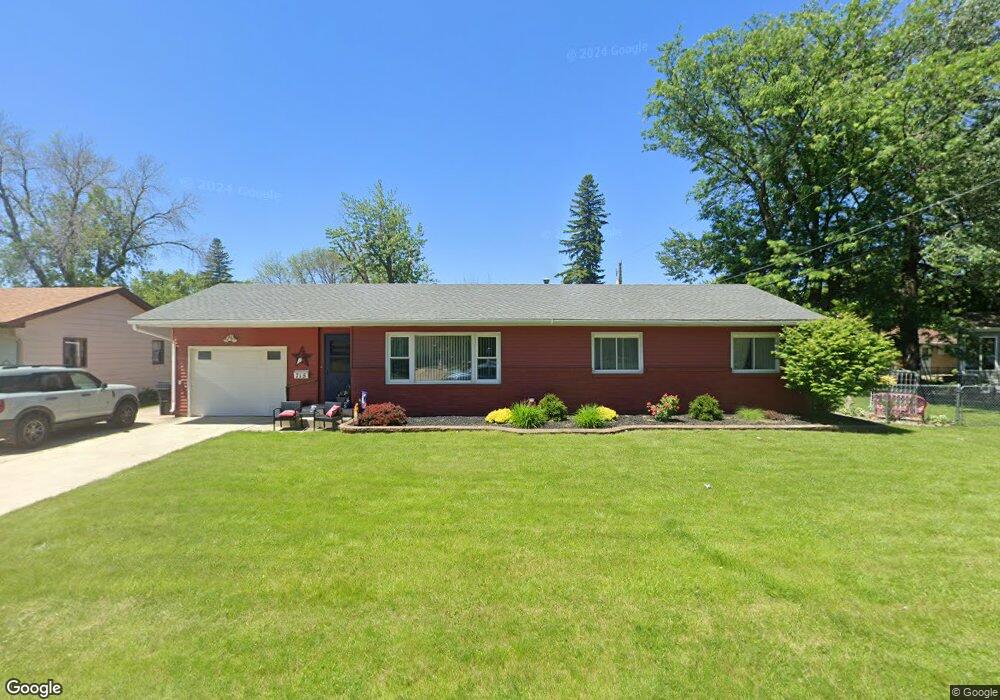
715 5th St NE Clarion, IA 50525
Estimated Value: $129,000 - $150,000
3
Beds
3
Baths
1,232
Sq Ft
$113/Sq Ft
Est. Value
About This Home
This home is located at 715 5th St NE, Clarion, IA 50525 and is currently estimated at $138,720, approximately $112 per square foot. 715 5th St NE is a home located in Wright County with nearby schools including Clarion-Goldfield-Dows Elementary School, Clarion-Goldfield-Dows Middle School, and Clarion-Goldfield-Dows High School.
Ownership History
Date
Name
Owned For
Owner Type
Purchase Details
Closed on
Jun 25, 2021
Sold by
Robinson Reina M and Robinson Darren K
Bought by
Figurski Susan
Current Estimated Value
Purchase Details
Closed on
Apr 25, 2006
Sold by
Lindstrom Larry and Lindstrom Jean
Bought by
Wicks Leroy A and Wicks Lisa A
Home Financials for this Owner
Home Financials are based on the most recent Mortgage that was taken out on this home.
Original Mortgage
$20,000
Interest Rate
6.42%
Mortgage Type
Future Advance Clause Open End Mortgage
Create a Home Valuation Report for This Property
The Home Valuation Report is an in-depth analysis detailing your home's value as well as a comparison with similar homes in the area
Home Values in the Area
Average Home Value in this Area
Purchase History
| Date | Buyer | Sale Price | Title Company |
|---|---|---|---|
| Figurski Susan | $119,500 | None Available | |
| Wicks Leroy A | $22,500 | None Available |
Source: Public Records
Mortgage History
| Date | Status | Borrower | Loan Amount |
|---|---|---|---|
| Previous Owner | Wicks Leroy A | $20,000 |
Source: Public Records
Tax History Compared to Growth
Tax History
| Year | Tax Paid | Tax Assessment Tax Assessment Total Assessment is a certain percentage of the fair market value that is determined by local assessors to be the total taxable value of land and additions on the property. | Land | Improvement |
|---|---|---|---|---|
| 2025 | $1,614 | $116,100 | $10,900 | $105,200 |
| 2024 | $1,614 | $94,500 | $10,900 | $83,600 |
| 2023 | $1,602 | $94,500 | $10,900 | $83,600 |
| 2022 | $1,572 | $80,500 | $10,900 | $69,600 |
| 2021 | $1,572 | $69,800 | $10,900 | $58,900 |
| 2020 | $1,581 | $71,000 | $10,900 | $60,100 |
| 2019 | $1,331 | $67,700 | $0 | $0 |
| 2018 | $1,332 | $67,700 | $0 | $0 |
| 2017 | $1,306 | $66,600 | $0 | $0 |
| 2016 | $1,250 | $66,600 | $0 | $0 |
| 2015 | $1,194 | $66,600 | $0 | $0 |
| 2014 | $1,194 | $71,600 | $0 | $0 |
Source: Public Records
Map
Nearby Homes
- 719 2nd St NE
- 620 Maple Ln
- 421 2nd Ave NE
- 212 3rd Ave NE
- 603 1st Ave NE
- 904 3rd Ave NE
- 903 2nd Ave NE
- 1003 2nd Ave NE
- 614 Central Ave E
- 314 1st St NW
- 909 1st Ave SE
- 306 White Fox Dr
- 213 8th St SE
- 219 8th Ave SE
- 708 2nd St SW
- 1000 1st St SE
- 1221 S Main St
- 2412 188th St
- 2405 186th St Unit 1
- 2405 186th St Unit 2