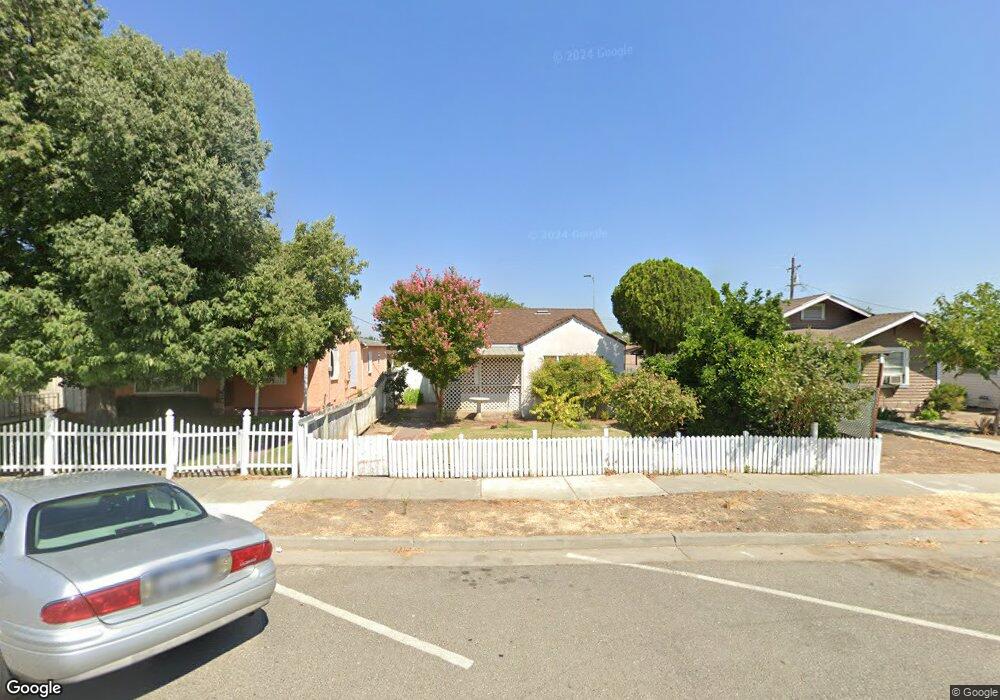
715 A St Orland, CA 95963
Estimated Value: $157,158 - $276,000
1
Bed
1
Bath
641
Sq Ft
$323/Sq Ft
Est. Value
About This Home
This home is located at 715 A St, Orland, CA 95963 and is currently estimated at $206,790, approximately $322 per square foot. 715 A St is a home located in Glenn County with nearby schools including Mill Street Elementary School, Fairview Elementary School, and Price Intermediate School.
Ownership History
Date
Name
Owned For
Owner Type
Purchase Details
Closed on
Oct 3, 2024
Sold by
Pinedo Arnulfo
Bought by
Pinedo Robertina
Current Estimated Value
Purchase Details
Closed on
Aug 2, 2007
Sold by
Ortega Miguel and Ortega Elvia
Bought by
Pinedo Arnulfo
Purchase Details
Closed on
Jun 7, 2004
Sold by
Mack Richard and Mack Patricia
Bought by
Ortega Miguel A and Ortega Elvin
Home Financials for this Owner
Home Financials are based on the most recent Mortgage that was taken out on this home.
Original Mortgage
$99,000
Interest Rate
5.99%
Mortgage Type
Unknown
Create a Home Valuation Report for This Property
The Home Valuation Report is an in-depth analysis detailing your home's value as well as a comparison with similar homes in the area
Home Values in the Area
Average Home Value in this Area
Purchase History
| Date | Buyer | Sale Price | Title Company |
|---|---|---|---|
| Pinedo Robertina | -- | None Listed On Document | |
| Pinedo Arnulfo | -- | Glenn County Title Company | |
| Ortega Miguel A | $110,000 | North State Title Co |
Source: Public Records
Mortgage History
| Date | Status | Borrower | Loan Amount |
|---|---|---|---|
| Previous Owner | Ortega Miguel A | $99,000 |
Source: Public Records
Tax History Compared to Growth
Tax History
| Year | Tax Paid | Tax Assessment Tax Assessment Total Assessment is a certain percentage of the fair market value that is determined by local assessors to be the total taxable value of land and additions on the property. | Land | Improvement |
|---|---|---|---|---|
| 2025 | $1,112 | $223,000 | $50,000 | $173,000 |
| 2024 | $1,112 | $96,579 | $77,265 | $19,314 |
| 2023 | $1,083 | $94,686 | $75,750 | $18,936 |
| 2022 | $1,065 | $92,830 | $74,265 | $18,565 |
| 2021 | $1,068 | $91,010 | $72,809 | $18,201 |
| 2020 | $1,068 | $90,078 | $72,063 | $18,015 |
| 2019 | $1,028 | $85,467 | $43,353 | $42,114 |
| 2018 | $921 | $79,876 | $40,517 | $39,359 |
| 2017 | $929 | $76,073 | $38,588 | $37,485 |
| 2016 | $852 | $72,450 | $36,750 | $35,700 |
| 2015 | $814 | $69,000 | $35,000 | $34,000 |
| 2014 | $770 | $65,048 | $33,075 | $31,973 |
Source: Public Records
Map
Nearby Homes