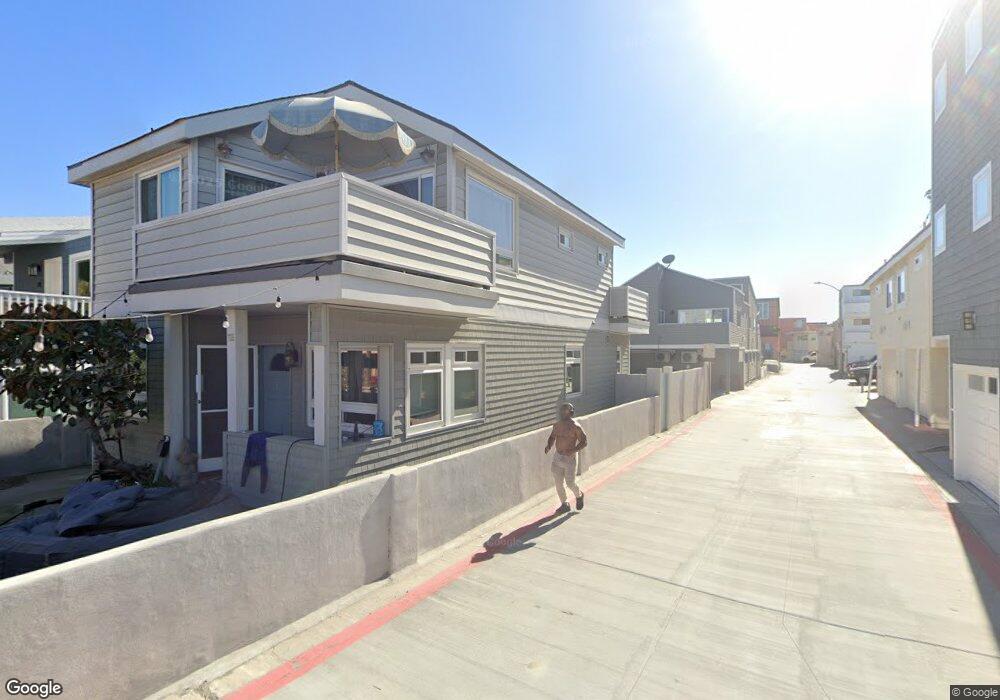
715 Brighton Ct San Diego, CA 92109
Mission Beach NeighborhoodEstimated Value: $1,779,000 - $2,785,000
2
Beds
2
Baths
1,654
Sq Ft
$1,380/Sq Ft
Est. Value
About This Home
This home is located at 715 Brighton Ct, San Diego, CA 92109 and is currently estimated at $2,281,712, approximately $1,379 per square foot. 715 Brighton Ct is a home located in San Diego County with nearby schools including Pacific Beach Elementary School, Pacific Beach Middle, and Mission Bay High School.
Ownership History
Date
Name
Owned For
Owner Type
Purchase Details
Closed on
Apr 21, 2023
Sold by
Naquin Rebecca A
Bought by
Rebecca Naquin Revocable Trust
Current Estimated Value
Purchase Details
Closed on
Apr 20, 2023
Sold by
Cody M Naquin M and Cody Rebecca A
Bought by
Naquin Rebecca A
Purchase Details
Closed on
Mar 20, 2014
Sold by
Naquin Cody and Naquin Rebecca A
Bought by
The Cody M Naquin & Rebecca A Naquin Fam and Naquin Rebecca A
Purchase Details
Closed on
Aug 24, 2012
Sold by
Derieux Mary S
Bought by
Naquin Cody and Naquin Rebecca A
Home Financials for this Owner
Home Financials are based on the most recent Mortgage that was taken out on this home.
Original Mortgage
$375,000
Interest Rate
3.36%
Mortgage Type
Purchase Money Mortgage
Purchase Details
Closed on
May 16, 2002
Sold by
Derieux Mary S and Davies Mary Susan
Bought by
Derieux Mary S
Create a Home Valuation Report for This Property
The Home Valuation Report is an in-depth analysis detailing your home's value as well as a comparison with similar homes in the area
Home Values in the Area
Average Home Value in this Area
Purchase History
| Date | Buyer | Sale Price | Title Company |
|---|---|---|---|
| Rebecca Naquin Revocable Trust | -- | None Listed On Document | |
| Naquin Rebecca A | -- | None Listed On Document | |
| The Cody M Naquin & Rebecca A Naquin Fam | -- | Stewart Title Of California | |
| Naquin Cody | $500,000 | American Coast Title | |
| Derieux Mary S | -- | -- |
Source: Public Records
Mortgage History
| Date | Status | Borrower | Loan Amount |
|---|---|---|---|
| Previous Owner | Naquin Cody | $375,000 |
Source: Public Records
Tax History Compared to Growth
Tax History
| Year | Tax Paid | Tax Assessment Tax Assessment Total Assessment is a certain percentage of the fair market value that is determined by local assessors to be the total taxable value of land and additions on the property. | Land | Improvement |
|---|---|---|---|---|
| 2025 | $14,878 | $1,231,417 | $1,108,279 | $123,138 |
| 2024 | $14,878 | $1,207,273 | $1,086,549 | $120,724 |
| 2023 | $14,549 | $1,160,395 | $1,044,358 | $116,037 |
| 2022 | $14,161 | $1,160,395 | $1,044,358 | $116,037 |
| 2021 | $14,063 | $1,137,643 | $1,023,881 | $113,762 |
| 2020 | $13,892 | $1,125,979 | $1,013,383 | $112,596 |
| 2019 | $13,644 | $1,103,902 | $993,513 | $110,389 |
| 2018 | $12,756 | $1,082,258 | $974,033 | $108,225 |
| 2017 | $12,462 | $1,061,038 | $954,935 | $106,103 |
| 2016 | $12,265 | $1,040,234 | $936,211 | $104,023 |
| 2015 | $12,084 | $1,024,610 | $922,149 | $102,461 |
| 2014 | $11,889 | $1,004,540 | $904,086 | $100,454 |
Source: Public Records
Map
Nearby Homes
- 2740 Ocean Front Walk
- 2727 Ocean Front Walk Unit 3
- 2820 Bayside Walk Unit 2
- 2735 Mission Blvd
- 2808 Bayside Walk Unit B
- 722 San Luis Rey Place Unit 24
- 817 San Luis Rey Place
- 801 Allerton Ct
- 2623 Ocean Front Walk
- 2617 Ocean Front Walk
- 2965 Mission Blvd Unit 4C
- 808 Ensenada Ct
- 2632 Bayside Walk
- 2999 Mission Blvd Unit 201
- 717 Island Ct
- 5123 Lotus St
- 5155 W Point Loma Blvd Unit 9
- 728 Jamaica Ct
- 5038-40 W Point Loma Blvd
- 5036 W Point Loma Blvd
- 721 Brighton Ct
- 719 Brighton Ct
- 723 Brighton Ct
- 2759 Ocean Front Walk
- 2761 Ocean Front Walk Unit 4
- 2761 Ocean Front Walk
- 2763 Ocean Front Walk
- 720 Balboa Ct Unit 2
- 714 Brighton Ct
- 2751 Ocean Front Walk Unit 57
- 725 Brighton Ct
- 720 Brighton Ct Unit 22
- 718 Balboa Ct Unit 1
- 706 Balboa Ct Unit 8
- 2755 Ocean Front Walk Unit 57
- 724 Brighton Ct
- 722 Balboa Ct Unit 24
- 731 Brighton Ct
- 2765 Ocean Front Walk Unit 3
- 2767 Ocean Front Walk Unit 2