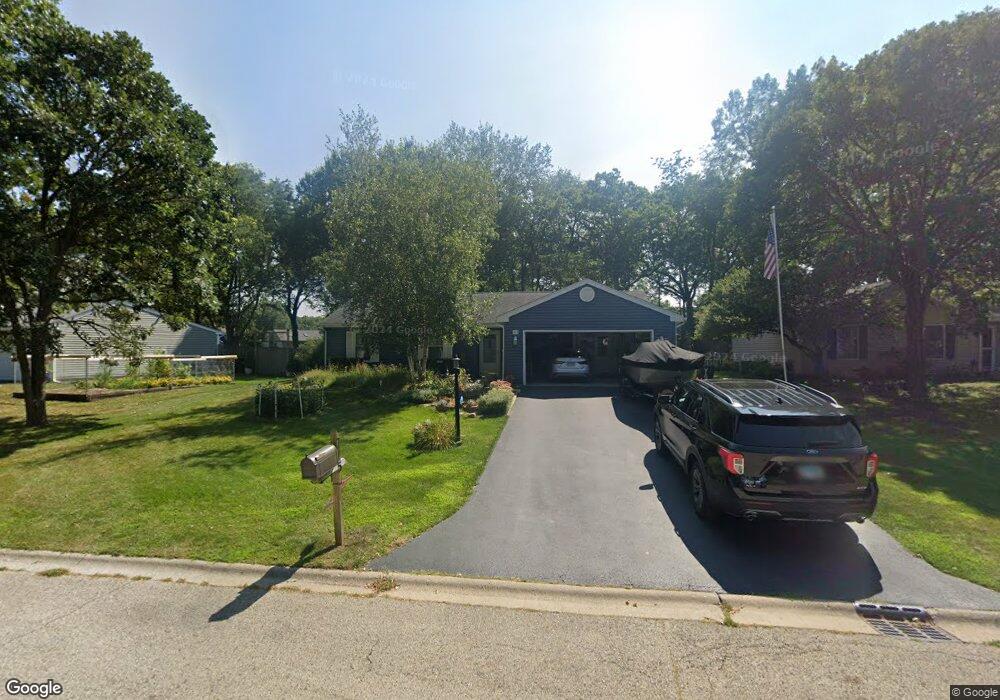
715 Dartmouth Dr Unit 7 Island Lake, IL 60042
West Island Lake NeighborhoodEstimated Value: $282,000 - $308,910
3
Beds
3
Baths
1,219
Sq Ft
$241/Sq Ft
Est. Value
About This Home
This home is located at 715 Dartmouth Dr Unit 7, Island Lake, IL 60042 and is currently estimated at $293,728, approximately $240 per square foot. 715 Dartmouth Dr Unit 7 is a home located in McHenry County with nearby schools including Cotton Creek School, Matthews Middle School, and Wauconda High School.
Ownership History
Date
Name
Owned For
Owner Type
Purchase Details
Closed on
May 28, 2014
Sold by
Scornavacco Michael and Scornavacco Ana
Bought by
Scornavacco Michael and Scornavacco Ana
Current Estimated Value
Home Financials for this Owner
Home Financials are based on the most recent Mortgage that was taken out on this home.
Original Mortgage
$168,447
Outstanding Balance
$53,910
Interest Rate
4.75%
Mortgage Type
New Conventional
Estimated Equity
$239,818
Purchase Details
Closed on
Oct 26, 2004
Sold by
Sauder Anissa and Peache Anissa M
Bought by
Peache Sean R
Home Financials for this Owner
Home Financials are based on the most recent Mortgage that was taken out on this home.
Original Mortgage
$144,000
Interest Rate
7.15%
Mortgage Type
Purchase Money Mortgage
Purchase Details
Closed on
Jun 30, 1994
Sold by
Pyles John and Pyles Patricia
Bought by
Peache Sean R and Peache Annisa M
Home Financials for this Owner
Home Financials are based on the most recent Mortgage that was taken out on this home.
Original Mortgage
$116,375
Interest Rate
7.75%
Create a Home Valuation Report for This Property
The Home Valuation Report is an in-depth analysis detailing your home's value as well as a comparison with similar homes in the area
Home Values in the Area
Average Home Value in this Area
Purchase History
| Date | Buyer | Sale Price | Title Company |
|---|---|---|---|
| Scornavacco Michael | -- | None Available | |
| Peache Sean R | -- | Pntn | |
| Peache Sean R | $122,500 | Plm Title Company |
Source: Public Records
Mortgage History
| Date | Status | Borrower | Loan Amount |
|---|---|---|---|
| Open | Scornavacco Michael | $168,447 | |
| Closed | Peache Sean R | $144,000 | |
| Closed | Peache Sean R | $116,375 |
Source: Public Records
Tax History Compared to Growth
Tax History
| Year | Tax Paid | Tax Assessment Tax Assessment Total Assessment is a certain percentage of the fair market value that is determined by local assessors to be the total taxable value of land and additions on the property. | Land | Improvement |
|---|---|---|---|---|
| 2024 | $5,328 | $83,524 | $21,553 | $61,971 |
| 2023 | $5,016 | $74,902 | $19,328 | $55,574 |
| 2022 | $4,817 | $59,352 | $12,210 | $47,142 |
| 2021 | $4,613 | $55,646 | $11,448 | $44,198 |
| 2020 | $4,349 | $53,978 | $11,105 | $42,873 |
| 2019 | $4,256 | $51,320 | $10,558 | $40,762 |
| 2018 | $4,596 | $49,135 | $9,917 | $39,218 |
| 2017 | $4,452 | $47,073 | $9,501 | $37,572 |
| 2016 | $4,331 | $44,913 | $9,065 | $35,848 |
| 2013 | -- | $36,801 | $8,627 | $28,174 |
Source: Public Records
Map
Nearby Homes
- 3625 Newport Dr
- 833 Dartmouth Dr Unit 7
- 811 Newport Dr
- 4024 Newport Dr
- 1040 Wimbledon Dr Unit 7
- 1125 Revere Ln
- 4125 Hale Ln Unit 10
- 3525 Southport Dr
- NEC Route 176 & Westridge Dr
- 0 Southport Dr
- 3816 Riverside Dr
- Lot 9 Burton Trail
- 4400 Riverside Dr
- 404 Lauren Ln
- 4504 Vista Dr
- 3618 Burton Trail
- 318 David Ct
- 1721 Il Route 176
- 3807 Mccabe Ave
- 3819 Woodlawn Dr
- 713 Dartmouth Dr Unit 7
- 717 Dartmouth Dr
- 711 Dartmouth Dr Unit 7
- 719 Dartmouth Dr
- 742 Dartmouth Dr
- 740 Dartmouth Dr
- 744 Dartmouth Dr
- 721 Dartmouth Dr Unit 7
- 709 Dartmouth Dr
- 738 Dartmouth Dr
- 714 Dartmouth Dr
- 746 Dartmouth Dr
- 712 Dartmouth Dr Unit 7
- 718 Dartmouth Dr
- 707 Dartmouth Dr
- 720 Dartmouth Dr Unit 7
- 748 Dartmouth Dr Unit 7
- 710 Dartmouth Dr Unit 7
- 722 Dartmouth Dr Unit 7
- 724 Dartmouth Dr Unit 7