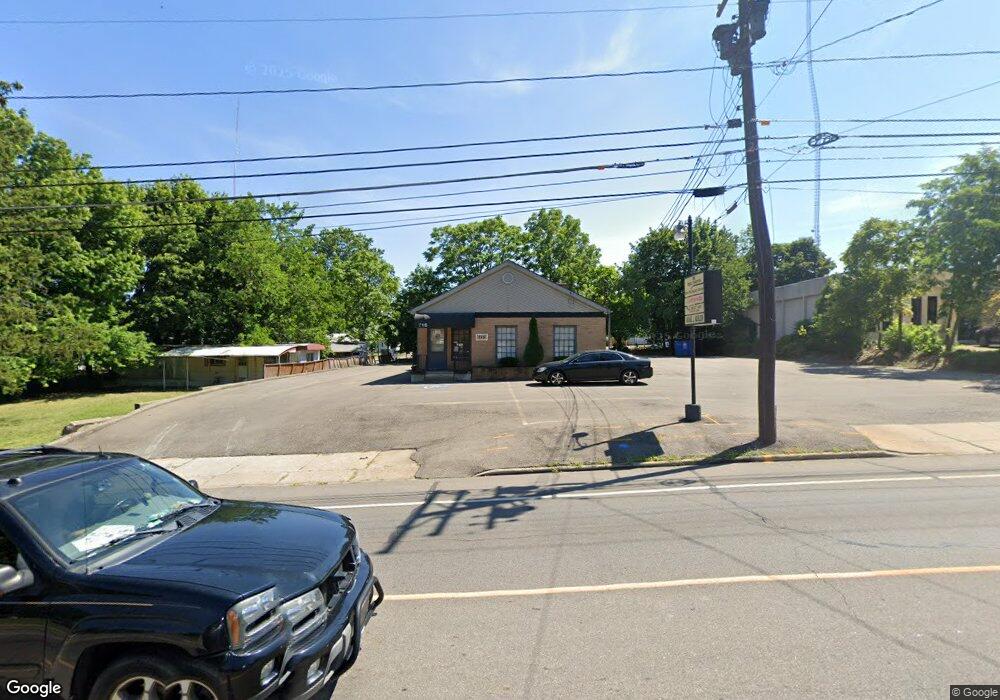
715 E Midlothian Blvd Unit 2, 9 Basement Youngstown, OH 44502
Estimated Value: $100,474
--
Bed
--
Bath
1,000
Sq Ft
$100/Sq Ft
Est. Value
About This Home
This home is located at 715 E Midlothian Blvd Unit 2, 9 Basement, Youngstown, OH 44502 and is currently estimated at $100,474, approximately $100 per square foot. 715 E Midlothian Blvd Unit 2, 9 Basement is a home located in Mahoning County with nearby schools including Robinwood Lane Elementary School, Boardman Glenwood Junior High School, and Boardman High School.
Ownership History
Date
Name
Owned For
Owner Type
Purchase Details
Closed on
Apr 25, 2020
Sold by
Greater Phoenix Real Estate Alliance
Bought by
Diverse Real Estate Options 31 Llc
Current Estimated Value
Home Financials for this Owner
Home Financials are based on the most recent Mortgage that was taken out on this home.
Original Mortgage
$45,000
Outstanding Balance
$40,025
Interest Rate
3.5%
Mortgage Type
Future Advance Clause Open End Mortgage
Estimated Equity
$60,449
Purchase Details
Closed on
Oct 24, 2019
Sold by
Tubbs Investment Properties Llc
Bought by
Greater Phoenix Real Estate Alliance
Purchase Details
Closed on
Jun 29, 1998
Bought by
Michael L Nicholson
Purchase Details
Closed on
Nov 4, 1993
Sold by
Nicholson Michael and M J
Bought by
Nicholson Michael and M J
Create a Home Valuation Report for This Property
The Home Valuation Report is an in-depth analysis detailing your home's value as well as a comparison with similar homes in the area
Home Values in the Area
Average Home Value in this Area
Purchase History
| Date | Buyer | Sale Price | Title Company |
|---|---|---|---|
| Diverse Real Estate Options 31 Llc | -- | None Available | |
| Greater Phoenix Real Estate Alliance | $55,000 | None Available | |
| Tubbs Investment Properties Llc | $500,000 | None Available | |
| Michael L Nicholson | -- | -- | |
| Nicholson Michael | $70,000 | -- |
Source: Public Records
Mortgage History
| Date | Status | Borrower | Loan Amount |
|---|---|---|---|
| Open | Diverse Real Estate Options 31 Llc | $45,000 |
Source: Public Records
Tax History Compared to Growth
Tax History
| Year | Tax Paid | Tax Assessment Tax Assessment Total Assessment is a certain percentage of the fair market value that is determined by local assessors to be the total taxable value of land and additions on the property. | Land | Improvement |
|---|---|---|---|---|
| 2024 | $1,696 | $23,350 | $4,740 | $18,610 |
| 2023 | $1,671 | $23,350 | $4,740 | $18,610 |
| 2022 | $1,607 | $19,220 | $4,740 | $14,480 |
| 2021 | $1,613 | $19,220 | $4,740 | $14,480 |
| 2020 | $1,622 | $19,220 | $4,740 | $14,480 |
| 2019 | $1,703 | $19,140 | $4,660 | $14,480 |
| 2018 | $1,417 | $19,140 | $4,660 | $14,480 |
| 2017 | $1,414 | $19,140 | $4,660 | $14,480 |
| 2016 | $1,647 | $22,340 | $5,590 | $16,750 |
| 2015 | $1,606 | $22,340 | $5,590 | $16,750 |
| 2014 | $1,605 | $22,340 | $5,590 | $16,750 |
| 2013 | $1,587 | $22,340 | $5,590 | $16,750 |
Source: Public Records
Map
Nearby Homes
- 703 E Judson Ave
- 554 E Judson Ave Unit 556
- 582 Roxbury Ave
- 4197 South Ave
- 3930 Sunset Dr
- 3726 Sunset Blvd
- 4212 South Ave
- 365 E Midlothian Blvd
- 371 Potomac Ave
- 734 Cambridge Ave
- 4038 Sunset Blvd
- 537 Cambridge Ave
- 353 Hilton Ave
- 358 E Auburndale Ave
- 241 Clarencedale Ave
- 230 Clarencedale Ave
- 805 E Boston Ave
- 486 Annawan Ln
- 4534 South Ave
- 204 Lowell Ave
- 715 E Midlothian Blvd Unit Basem
- 715 E Midlothian Blvd Unit 2
- 715 E Midlothian Blvd Unit 9
- 715 E Midlothian Blvd Unit 3
- 715 E Midlothian Blvd Unit B
- 715 E Midlothian Blvd Unit 9 B
- 715 E Midlothian Blvd
- 707 E Midlothian Blvd
- 730 E Midlothian Blvd
- 738 E Midlothian Blvd
- 722 E Midlothian Blvd
- 716 E Midlothian Blvd
- 830 E Midlothian Blvd
- 704 E Midlothian Blvd
- 588 E Midlothian Blvd
- 840 E Midlothian Blvd
- 731 E Judson Ave
- 735 E Judson Ave
- 713 E Judson Ave
- 717 E Judson Ave