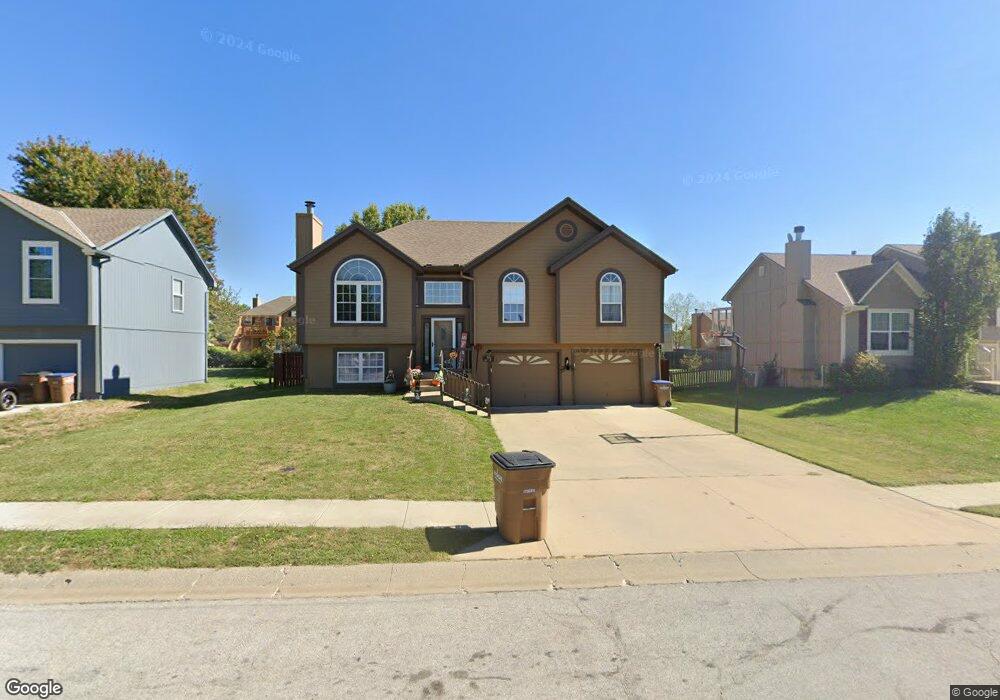
715 Furlong Dr Raymore, MO 64083
Estimated Value: $284,256 - $328,000
3
Beds
3
Baths
1,229
Sq Ft
$256/Sq Ft
Est. Value
About This Home
This home is located at 715 Furlong Dr, Raymore, MO 64083 and is currently estimated at $314,814, approximately $256 per square foot. 715 Furlong Dr is a home located in Cass County with nearby schools including Raymore Elementary School, Raymore-Peculiar East Middle School, and Raymore-Peculiar Senior High School.
Ownership History
Date
Name
Owned For
Owner Type
Purchase Details
Closed on
Mar 4, 2009
Sold by
Bank Of New York
Bought by
Morris James J and Morris Julie A
Current Estimated Value
Home Financials for this Owner
Home Financials are based on the most recent Mortgage that was taken out on this home.
Original Mortgage
$120,772
Outstanding Balance
$76,134
Interest Rate
5.13%
Mortgage Type
FHA
Estimated Equity
$238,680
Purchase Details
Closed on
Oct 22, 2008
Sold by
Reyes Christina M and Reyes Anthony D
Bought by
The Bank Of New York
Purchase Details
Closed on
Jun 26, 2006
Sold by
Defrain R Douglas and Defrain Kyle
Bought by
Reyes Anthony D and Reyes Christina M
Home Financials for this Owner
Home Financials are based on the most recent Mortgage that was taken out on this home.
Original Mortgage
$154,000
Interest Rate
9.35%
Mortgage Type
Adjustable Rate Mortgage/ARM
Create a Home Valuation Report for This Property
The Home Valuation Report is an in-depth analysis detailing your home's value as well as a comparison with similar homes in the area
Home Values in the Area
Average Home Value in this Area
Purchase History
| Date | Buyer | Sale Price | Title Company |
|---|---|---|---|
| Morris James J | -- | None Available | |
| The Bank Of New York | $121,833 | -- | |
| Reyes Anthony D | -- | -- |
Source: Public Records
Mortgage History
| Date | Status | Borrower | Loan Amount |
|---|---|---|---|
| Open | Morris James J | $120,772 | |
| Previous Owner | Reyes Anthony D | $154,000 |
Source: Public Records
Tax History
| Year | Tax Paid | Tax Assessment Tax Assessment Total Assessment is a certain percentage of the fair market value that is determined by local assessors to be the total taxable value of land and additions on the property. | Land | Improvement |
|---|---|---|---|---|
| 2025 | $2,698 | $37,050 | $6,190 | $30,860 |
| 2024 | $2,698 | $33,150 | $5,630 | $27,520 |
| 2023 | $2,694 | $33,150 | $5,630 | $27,520 |
| 2022 | $2,419 | $29,570 | $5,630 | $23,940 |
| 2021 | $2,420 | $29,570 | $5,630 | $23,940 |
| 2020 | $2,380 | $28,570 | $5,630 | $22,940 |
| 2019 | $2,297 | $28,570 | $5,630 | $22,940 |
| 2018 | $2,069 | $24,850 | $4,690 | $20,160 |
| 2017 | $1,897 | $24,850 | $4,690 | $20,160 |
| 2016 | $1,897 | $23,640 | $4,690 | $18,950 |
| 2015 | $1,898 | $23,640 | $4,690 | $18,950 |
| 2014 | $1,882 | $23,430 | $4,690 | $18,740 |
| 2013 | -- | $23,430 | $4,690 | $18,740 |
Source: Public Records
Map
Nearby Homes
- 709 Derby St
- 804 S Washington St
- 713 S Sunset Ln
- 605 S Franklin St
- 814 Coventry Ln
- 817 Clancy Ct
- 600 W Buena Vista Dr
- 506 S Adams St
- 1024 S Madison St
- 727 Country Ln
- 901 W Lucy Webb Rd
- 503 S Harrison Ave
- 405 S Monroe St
- 1105 Creekside Ct
- 720 Sandpiper St
- 1103 Carlisle Dr
- 1108 Yokley Dr
- 211 S Franklin St
- 108 Rainbow Cir
- 305 E Olive St
Your Personal Tour Guide
Ask me questions while you tour the home.