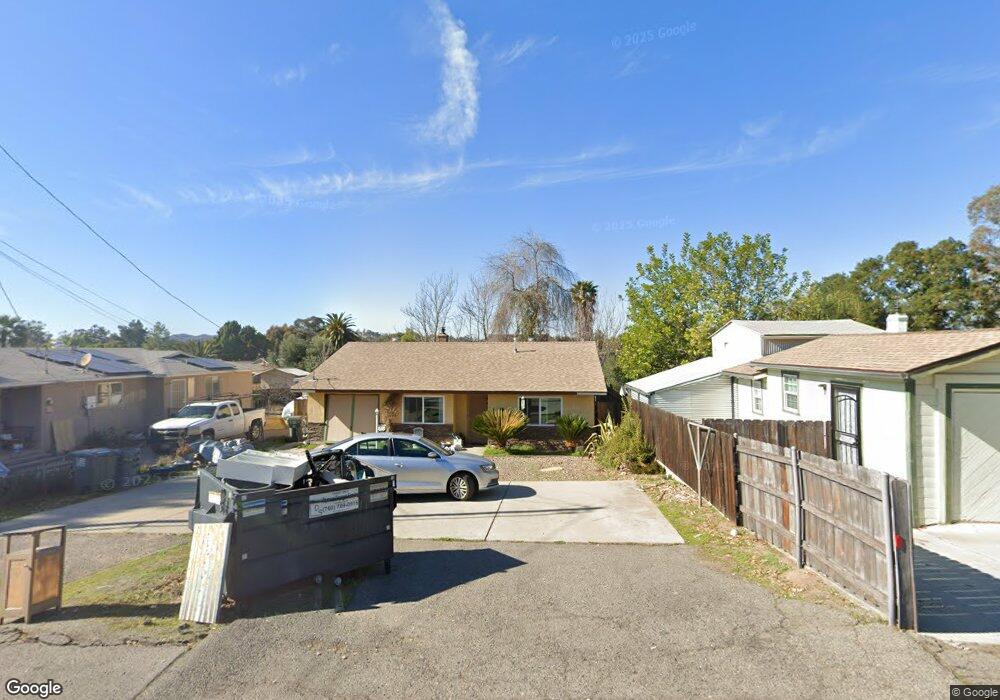
715 G St Ramona, CA 92065
Estimated Value: $669,000 - $712,000
4
Beds
2
Baths
1,602
Sq Ft
$427/Sq Ft
Est. Value
About This Home
This home is located at 715 G St, Ramona, CA 92065 and is currently estimated at $683,528, approximately $426 per square foot. 715 G St is a home located in San Diego County with nearby schools including Ramona Elementary School, Olive Peirce Middle School, and Ramona High School.
Ownership History
Date
Name
Owned For
Owner Type
Purchase Details
Closed on
Apr 15, 2026
Sold by
Dixon Daniel and Dixon Heather
Bought by
Dixon Heather
Current Estimated Value
Purchase Details
Closed on
Oct 7, 2008
Sold by
Lasalle Bank National Association
Bought by
Dixon Daniel W and Dixon Heather
Home Financials for this Owner
Home Financials are based on the most recent Mortgage that was taken out on this home.
Original Mortgage
$228,937
Interest Rate
6.04%
Mortgage Type
FHA
Purchase Details
Closed on
Mar 27, 2008
Sold by
Pianowski Joshua and Pianowski Candelynee
Bought by
Lasalle Bank Na
Purchase Details
Closed on
Jan 24, 2005
Sold by
Young Bernard L
Bought by
Pianowski Joshua and Pianowski Candelynne
Home Financials for this Owner
Home Financials are based on the most recent Mortgage that was taken out on this home.
Original Mortgage
$342,000
Interest Rate
6.62%
Mortgage Type
Stand Alone First
Create a Home Valuation Report for This Property
The Home Valuation Report is an in-depth analysis detailing your home's value as well as a comparison with similar homes in the area
Home Values in the Area
Average Home Value in this Area
Purchase History
We collect this data history from publicly available records. To have your information removed, we recommend requesting removal directly through your county’s website.
| Date | Buyer | Sale Price | Title Company |
|---|---|---|---|
| Dixon Heather | -- | None Listed On Document | |
| Dixon Daniel W | $260,000 | Chicago Title Company | |
| Lasalle Bank Na | $259,680 | Fidelity National Title | |
| Pianowski Joshua | $380,000 | Diversified Title & Escrow C |
Source: Public Records
Mortgage History
We collect this data history from publicly available records. To have your information removed, we recommend requesting removal directly through your county’s website.
| Date | Status | Borrower | Loan Amount |
|---|---|---|---|
| Previous Owner | Dixon Daniel W | $228,937 | |
| Previous Owner | Pianowski Joshua | $342,000 |
Source: Public Records
Tax History
| Year | Tax Paid | Tax Assessment Tax Assessment Total Assessment is a certain percentage of the fair market value that is determined by local assessors to be the total taxable value of land and additions on the property. | Land | Improvement |
|---|---|---|---|---|
| 2025 | $4,629 | $334,799 | $154,522 | $180,277 |
| 2024 | $4,629 | $328,236 | $151,493 | $176,743 |
| 2023 | $4,176 | $321,801 | $148,523 | $173,278 |
| 2022 | $4,313 | $315,492 | $145,611 | $169,881 |
| 2021 | $4,257 | $309,306 | $142,756 | $166,550 |
| 2020 | $4,225 | $306,136 | $141,293 | $164,843 |
| 2019 | $4,130 | $300,134 | $138,523 | $161,611 |
| 2018 | $4,026 | $294,250 | $135,807 | $158,443 |
| 2017 | $3,964 | $288,482 | $133,145 | $155,337 |
| 2016 | $3,871 | $282,827 | $130,535 | $152,292 |
| 2015 | $3,777 | $278,580 | $128,575 | $150,005 |
| 2014 | $3,668 | $273,124 | $126,057 | $147,067 |
Source: Public Records
Map
Nearby Homes
Your Personal Tour Guide
Ask me questions while you tour the home.