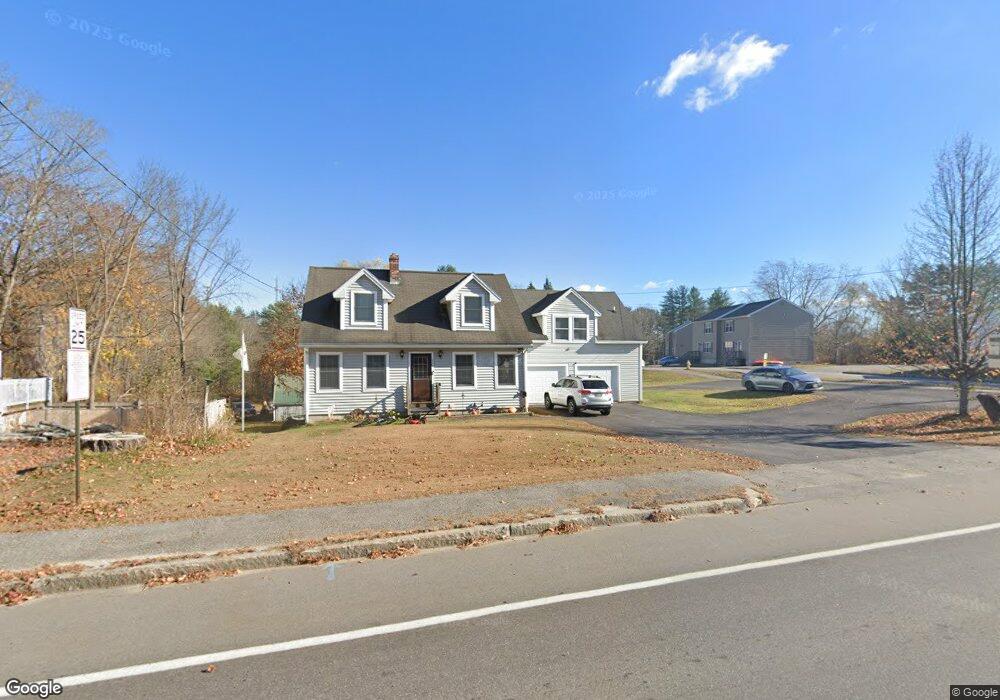
715 Gray Rd Gorham, ME 04038
Estimated Value: $546,216 - $665,000
3
Beds
3
Baths
1,980
Sq Ft
$298/Sq Ft
Est. Value
About This Home
This home is located at 715 Gray Rd, Gorham, ME 04038 and is currently estimated at $590,804, approximately $298 per square foot. 715 Gray Rd is a home with nearby schools including Great Falls Elementary School, Gorham Middle School, and Gorham High School.
Ownership History
Date
Name
Owned For
Owner Type
Purchase Details
Closed on
Feb 10, 2017
Sold by
Fogg Pter M
Bought by
Fogg Kenneth W
Current Estimated Value
Home Financials for this Owner
Home Financials are based on the most recent Mortgage that was taken out on this home.
Original Mortgage
$160,256
Outstanding Balance
$129,306
Interest Rate
3.75%
Mortgage Type
FHA
Estimated Equity
$461,498
Purchase Details
Closed on
Oct 24, 2012
Sold by
Fogg Julia V Est and Fogg
Bought by
Fogg Kenneth W and Fogg Peter M
Create a Home Valuation Report for This Property
The Home Valuation Report is an in-depth analysis detailing your home's value as well as a comparison with similar homes in the area
Home Values in the Area
Average Home Value in this Area
Purchase History
| Date | Buyer | Sale Price | Title Company |
|---|---|---|---|
| Fogg Kenneth W | -- | -- | |
| Fogg Kenneth W | -- | -- | |
| Fogg Kenneth W | -- | -- | |
| Fogg Kenneth W | -- | -- | |
| Fogg Kenneth W | -- | -- |
Source: Public Records
Mortgage History
| Date | Status | Borrower | Loan Amount |
|---|---|---|---|
| Open | Fogg Kenneth W | $160,256 | |
| Closed | Fogg Kenneth W | $160,256 |
Source: Public Records
Tax History
| Year | Tax Paid | Tax Assessment Tax Assessment Total Assessment is a certain percentage of the fair market value that is determined by local assessors to be the total taxable value of land and additions on the property. | Land | Improvement |
|---|---|---|---|---|
| 2025 | $6,007 | $405,900 | $72,800 | $333,100 |
| 2024 | $5,967 | $405,900 | $72,800 | $333,100 |
| 2023 | $5,581 | $405,900 | $72,800 | $333,100 |
| 2022 | $5,216 | $405,900 | $72,800 | $333,100 |
| 2021 | $4,640 | $239,200 | $70,200 | $169,000 |
| 2020 | $4,545 | $239,200 | $70,200 | $169,000 |
| 2019 | $4,533 | $239,200 | $70,200 | $169,000 |
| 2018 | $4,353 | $239,200 | $70,200 | $169,000 |
| 2017 | $4,090 | $239,200 | $70,200 | $169,000 |
| 2016 | $4,066 | $239,200 | $70,200 | $169,000 |
| 2015 | $3,899 | $239,200 | $70,200 | $169,000 |
| 2014 | $3,459 | $198,800 | $56,200 | $142,600 |
| 2013 | $3,439 | $198,800 | $56,200 | $142,600 |
Source: Public Records
Map
Nearby Homes
- 771 Gray Rd
- 51 Newell St
- 46 Sebago Lake Rd
- 209 Mosher Rd
- 7 Trestle Way
- 29 Victoria Ln
- 0 Meredith Dr
- 17 Betty Ln
- 0 Libby Ave
- 42 Barnes Rd
- 12 Dolley Farm Rd Unit 6
- 93 River Rd
- Lot 4 Highland Cliff Rd
- 26 Marshall Valley Rd
- 30 Marshall Valley Rd
- 16 Norway Rd
- 8 Beaulieu Dr
- 65 Batchelder Rd
- 20 Revolution Dr
- 194 Falcon Crest Dr Unit 60
Your Personal Tour Guide
Ask me questions while you tour the home.