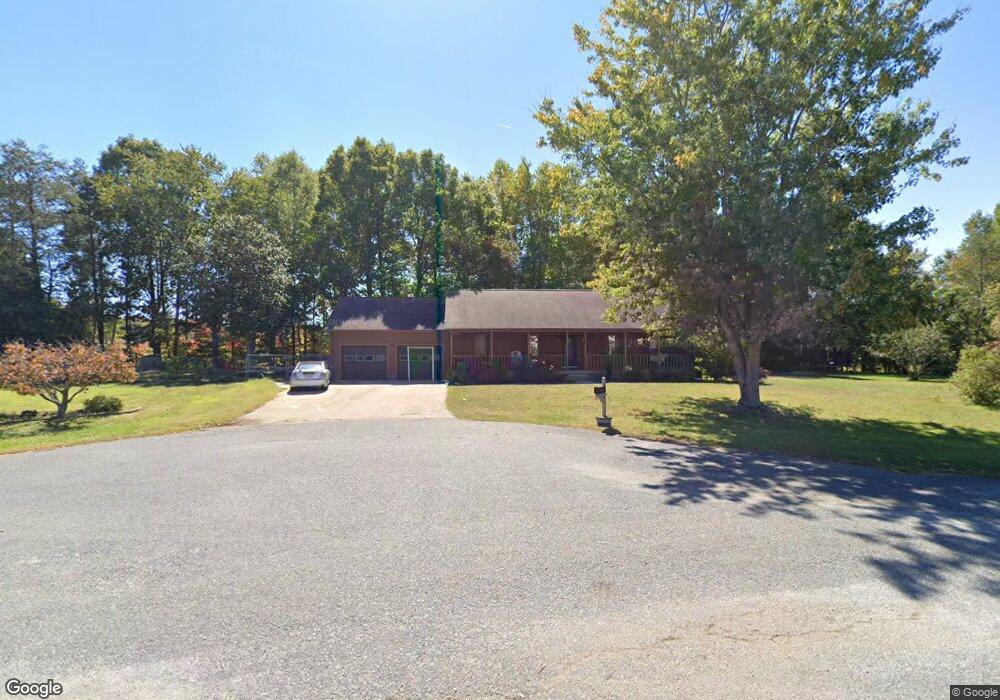
715 Hummingbird Cir Salisbury, NC 28146
Estimated Value: $259,558 - $294,000
--
Bed
2
Baths
1,440
Sq Ft
$191/Sq Ft
Est. Value
About This Home
This home is located at 715 Hummingbird Cir, Salisbury, NC 28146 and is currently estimated at $274,640, approximately $190 per square foot. 715 Hummingbird Cir is a home located in Rowan County with nearby schools including Granite Quarry Elementary School, Charles C Erwin Middle School, and East Rowan High School.
Ownership History
Date
Name
Owned For
Owner Type
Purchase Details
Closed on
May 19, 2020
Sold by
Elium Randall D and Elium Pamela P
Bought by
Roth Lincoln Nathaniel and Roth Dawn Marie
Current Estimated Value
Home Financials for this Owner
Home Financials are based on the most recent Mortgage that was taken out on this home.
Original Mortgage
$140,505
Outstanding Balance
$124,507
Interest Rate
3.3%
Mortgage Type
New Conventional
Estimated Equity
$150,133
Purchase Details
Closed on
Nov 30, 2016
Sold by
Carriker Pamela Diane and Weinhold Cynthia Jan
Bought by
Elium Randall D and Elium Pamela P
Home Financials for this Owner
Home Financials are based on the most recent Mortgage that was taken out on this home.
Original Mortgage
$119,000
Interest Rate
2.79%
Mortgage Type
Farmers Home Administration
Purchase Details
Closed on
Sep 15, 2000
Bought by
Carriker Pamela Diane
Create a Home Valuation Report for This Property
The Home Valuation Report is an in-depth analysis detailing your home's value as well as a comparison with similar homes in the area
Home Values in the Area
Average Home Value in this Area
Purchase History
| Date | Buyer | Sale Price | Title Company |
|---|---|---|---|
| Roth Lincoln Nathaniel | $141,000 | None Available | |
| Elium Randall D | $140,000 | None Available | |
| Carriker Pamela Diane | $123,000 | -- |
Source: Public Records
Mortgage History
| Date | Status | Borrower | Loan Amount |
|---|---|---|---|
| Open | Roth Lincoln Nathaniel | $140,505 | |
| Previous Owner | Elium Randall D | $119,000 |
Source: Public Records
Tax History Compared to Growth
Tax History
| Year | Tax Paid | Tax Assessment Tax Assessment Total Assessment is a certain percentage of the fair market value that is determined by local assessors to be the total taxable value of land and additions on the property. | Land | Improvement |
|---|---|---|---|---|
| 2025 | $1,447 | $227,889 | $35,000 | $192,889 |
| 2024 | $1,447 | $227,889 | $35,000 | $192,889 |
| 2023 | $1,447 | $227,889 | $35,000 | $192,889 |
| 2022 | $1,003 | $140,811 | $22,500 | $118,311 |
| 2021 | $975 | $140,811 | $22,500 | $118,311 |
| 2020 | $975 | $140,811 | $22,500 | $118,311 |
| 2019 | $975 | $140,811 | $22,500 | $118,311 |
| 2018 | $830 | $120,776 | $22,500 | $98,276 |
| 2017 | $830 | $120,776 | $22,500 | $98,276 |
| 2016 | $830 | $120,776 | $22,500 | $98,276 |
| 2015 | $843 | $120,776 | $22,500 | $98,276 |
| 2014 | $834 | $121,796 | $22,500 | $99,296 |
Source: Public Records
Map
Nearby Homes
- 0000 Dunns Mountain Rd
- 3980 Fish Pond Rd
- 108 Devynne Ct
- 410 Yadkin St
- 408 Yadkin St
- Montcrest Plan at Shay Crossing
- TA4000 Plan at Shay Crossing
- Winslow Plan at Shay Crossing
- TA1600 Plan at Shay Crossing
- TA1800 Plan at Shay Crossing
- TA3000 Plan at Shay Crossing
- TA2300 Plan at Shay Crossing
- Baxter Plan at Shay Crossing
- Elon Plan at Shay Crossing
- Lido Plan at Shay Crossing
- Knox Plan at Shay Crossing
- Alder Plan at Shay Crossing
- Kane Plan at Shay Crossing
- Abigale Plan at Shay Crossing
- Coronado Plan at Shay Crossing
- 555 Hummingbird Cir
- 850 Hummingbird Cir
- 730 Hummingbird Cir
- 455 Hummingbird Cir
- 620 Hummingbird Cir
- 550 Hummingbird Cir
- 355 Hummingbird Cir
- 450 Hummingbird Cir
- 350 Hummingbird Cir
- 275 Hummingbird Cir
- 170 Trantham Ln
- 310 Hummingbird Cir
- 172 Trantham Ln
- 215 Hummingbird Cir
- 220 Hummingbird Cir
- 1190 Old Stone House Rd
- 1240 Old Stone House Rd
- 1270 Old Stone House Rd
- 2085 Lake Rd
- 1185 Old Stone House Rd