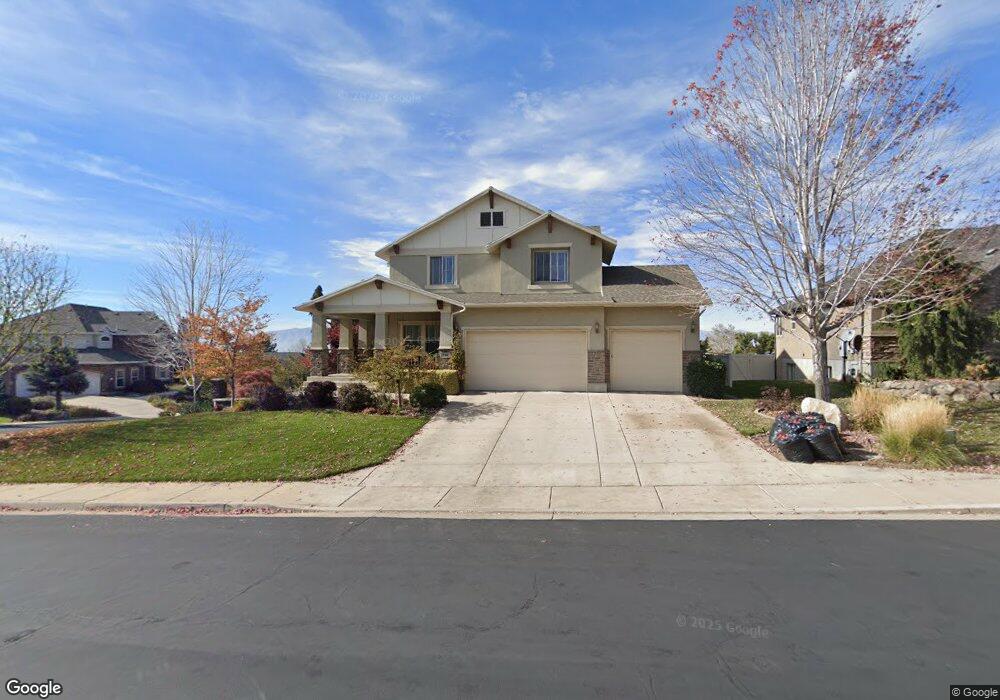
715 N 40 E Lindon, UT 84042
Estimated Value: $1,027,811 - $1,129,000
4
Beds
4
Baths
2,611
Sq Ft
$412/Sq Ft
Est. Value
About This Home
This home is located at 715 N 40 E, Lindon, UT 84042 and is currently estimated at $1,075,703, approximately $411 per square foot. 715 N 40 E is a home with nearby schools including Lindon Elementary School, Oak Canyon Junior High School, and Pleasant Grove High School.
Ownership History
Date
Name
Owned For
Owner Type
Purchase Details
Closed on
Dec 10, 2018
Sold by
Lioyd Michael J and Lioyd Kimberly L
Bought by
Lioyd Kimberly L and Lioyd Michael J
Current Estimated Value
Purchase Details
Closed on
Sep 9, 2011
Sold by
Lloyd Kimberly L and Lloyd Michael J
Bought by
Lloyd Michael J and Lloyd Kimberly L
Home Financials for this Owner
Home Financials are based on the most recent Mortgage that was taken out on this home.
Original Mortgage
$348,400
Outstanding Balance
$30,968
Interest Rate
4.37%
Mortgage Type
New Conventional
Estimated Equity
$1,044,735
Purchase Details
Closed on
Jul 6, 2009
Sold by
Ivory Homes Ltd
Bought by
Lloyd Kimberly L and Lloyd Michael J
Home Financials for this Owner
Home Financials are based on the most recent Mortgage that was taken out on this home.
Original Mortgage
$357,300
Interest Rate
5.25%
Mortgage Type
Purchase Money Mortgage
Create a Home Valuation Report for This Property
The Home Valuation Report is an in-depth analysis detailing your home's value as well as a comparison with similar homes in the area
Home Values in the Area
Average Home Value in this Area
Purchase History
| Date | Buyer | Sale Price | Title Company |
|---|---|---|---|
| Lioyd Kimberly L | -- | None Available | |
| Lloyd Michael J | -- | Union Title | |
| Lloyd Kimberly L | -- | Cottonwood Title Insurance | |
| Ivory Homes Ltd | -- | Cottonwood Title Insurance |
Source: Public Records
Mortgage History
| Date | Status | Borrower | Loan Amount |
|---|---|---|---|
| Open | Lloyd Michael J | $348,400 | |
| Closed | Ivory Homes Ltd | $357,300 |
Source: Public Records
Tax History
| Year | Tax Paid | Tax Assessment Tax Assessment Total Assessment is a certain percentage of the fair market value that is determined by local assessors to be the total taxable value of land and additions on the property. | Land | Improvement |
|---|---|---|---|---|
| 2025 | $3,990 | $499,180 | -- | -- |
| 2024 | $3,990 | $491,920 | $0 | $0 |
| 2023 | $3,770 | $499,180 | $0 | $0 |
| 2022 | $3,892 | $497,860 | $0 | $0 |
| 2021 | $3,398 | $655,300 | $278,200 | $377,100 |
| 2020 | $3,242 | $615,500 | $252,900 | $362,600 |
| 2019 | $2,873 | $569,100 | $206,500 | $362,600 |
| 2018 | $2,901 | $541,700 | $181,200 | $360,500 |
| 2017 | $2,842 | $284,570 | $0 | $0 |
| 2016 | $2,882 | $266,970 | $0 | $0 |
| 2015 | $2,721 | $238,205 | $0 | $0 |
| 2014 | $2,593 | $224,895 | $0 | $0 |
Source: Public Records
Map
Nearby Homes
- 517 N 80 W
- 433 N Locust Ave
- 308 E 750 N
- 1172 E Murdock Dr
- 314 E 750 N
- 341 W 600 N
- 355 W 600 N
- 789 E 820 S
- 1176 E 470 S
- 1017 E 450 S
- 793 E Orchard Dr
- 271 N 400 E Unit 1
- 696 S Locust Ave
- 650 S 1600 E
- 190 E 800 N Unit 4
- 150 E 800 N Unit 2
- 170 E 800 N Unit 3
- 130 E 800 N Unit 1
- 1541 E Blackhawk Dr
- 325 S 1300 E
Your Personal Tour Guide
Ask me questions while you tour the home.