715 N 5th St Drexel, MO 64742
Estimated Value: $195,000 - $369,000
4
Beds
3
Baths
2,746
Sq Ft
$107/Sq Ft
Est. Value
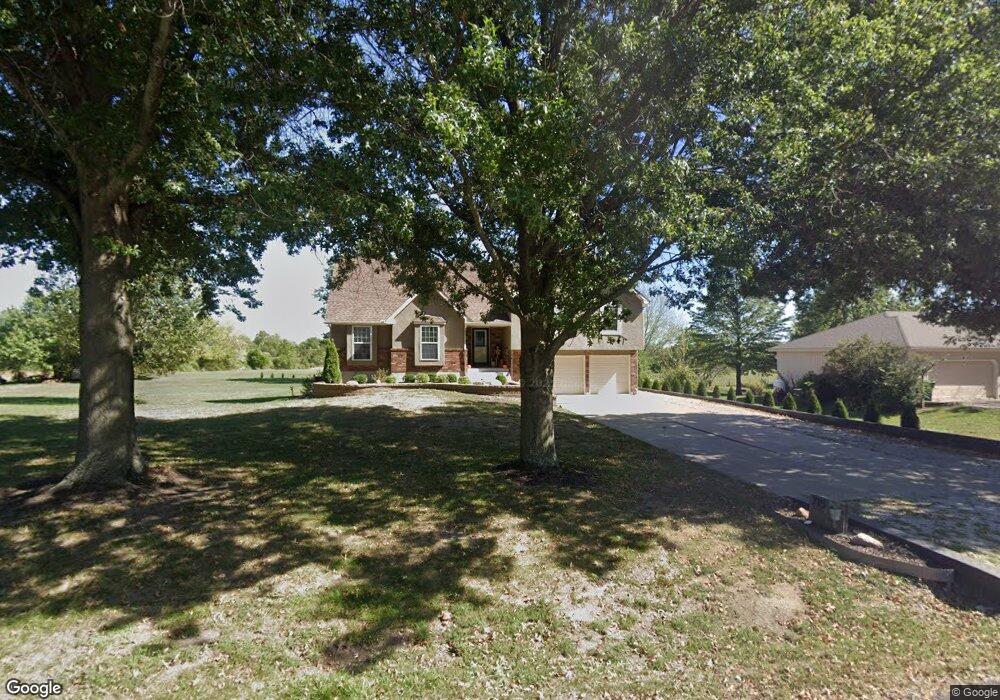
About This Home
This home is located at 715 N 5th St, Drexel, MO 64742 and is currently estimated at $294,557, approximately $107 per square foot. 715 N 5th St is a home located in Cass County with nearby schools including Drexel Elementary School and Drexel High School.
Ownership History
Date
Name
Owned For
Owner Type
Purchase Details
Closed on
Oct 6, 2008
Sold by
Wheeler Michael J and Wheeler Jenny
Bought by
Mayabb Chad and Mayabb Amy
Current Estimated Value
Home Financials for this Owner
Home Financials are based on the most recent Mortgage that was taken out on this home.
Original Mortgage
$186,735
Outstanding Balance
$122,680
Interest Rate
6.35%
Mortgage Type
New Conventional
Estimated Equity
$171,877
Purchase Details
Closed on
Apr 8, 2008
Sold by
Hsbc Bank Usa Na
Bought by
Wheeler Michael J
Purchase Details
Closed on
May 1, 2007
Sold by
Thomas Wm Patrick and Thomas Trudy
Bought by
Hsbc Bank Usa Na
Purchase Details
Closed on
Sep 29, 2005
Sold by
Dlj Mortgage Capital Inc
Bought by
Thomas William P and Thomas Trudy L
Home Financials for this Owner
Home Financials are based on the most recent Mortgage that was taken out on this home.
Original Mortgage
$136,500
Interest Rate
10.99%
Mortgage Type
Adjustable Rate Mortgage/ARM
Create a Home Valuation Report for This Property
The Home Valuation Report is an in-depth analysis detailing your home's value as well as a comparison with similar homes in the area
Purchase History
| Date | Buyer | Sale Price | Title Company |
|---|---|---|---|
| Mayabb Chad | -- | -- | |
| Wheeler Michael J | -- | -- | |
| Hsbc Bank Usa Na | $97,603 | -- | |
| Thomas William P | -- | -- |
Source: Public Records
Mortgage History
| Date | Status | Borrower | Loan Amount |
|---|---|---|---|
| Open | Mayabb Chad | $186,735 | |
| Previous Owner | Thomas William P | $136,500 | |
| Closed | Wheeler Michael J | $0 |
Source: Public Records
Tax History
| Year | Tax Paid | Tax Assessment Tax Assessment Total Assessment is a certain percentage of the fair market value that is determined by local assessors to be the total taxable value of land and additions on the property. | Land | Improvement |
|---|---|---|---|---|
| 2025 | $2,077 | $32,830 | $3,980 | $28,850 |
| 2024 | $2,077 | $28,780 | $3,620 | $25,160 |
| 2023 | $2,067 | $28,780 | $3,620 | $25,160 |
| 2022 | $1,789 | $25,490 | $3,620 | $21,870 |
| 2021 | $1,682 | $25,490 | $3,620 | $21,870 |
| 2020 | $1,618 | $24,620 | $3,620 | $21,000 |
| 2019 | $1,585 | $24,620 | $3,620 | $21,000 |
| 2018 | $1,425 | $21,810 | $2,890 | $18,920 |
| 2017 | $1,352 | $21,810 | $2,890 | $18,920 |
| 2016 | $1,352 | $20,670 | $2,890 | $17,780 |
| 2015 | $1,364 | $20,670 | $2,890 | $17,780 |
| 2014 | $1,383 | $20,670 | $2,890 | $17,780 |
| 2013 | -- | $20,670 | $2,890 | $17,780 |
Source: Public Records
Map
Nearby Homes
- 445 E Hickory St
- 325 E Hickory St
- 307 E Hickory St
- 421 E Walnut St
- 107 E Maple St
- 223 N 2nd St Unit 343
- 101 E Main St
- 112 W Pine St
- 101 W Main St
- 221 S 3rd St
- 214 E Cass St
- 0000C S State Route D
- 00000 Coldwater Spring Rd
- 33820 State Route D
- 0 307th & S State Route D Hwy Unit HMS2538031
- 15911 NW County Road 14781
- 4033 W 367th St
- 13961 NW County Road 15002
- 5528 W 367th St
- 0 W 351st St
Your Personal Tour Guide
Ask me questions while you tour the home.