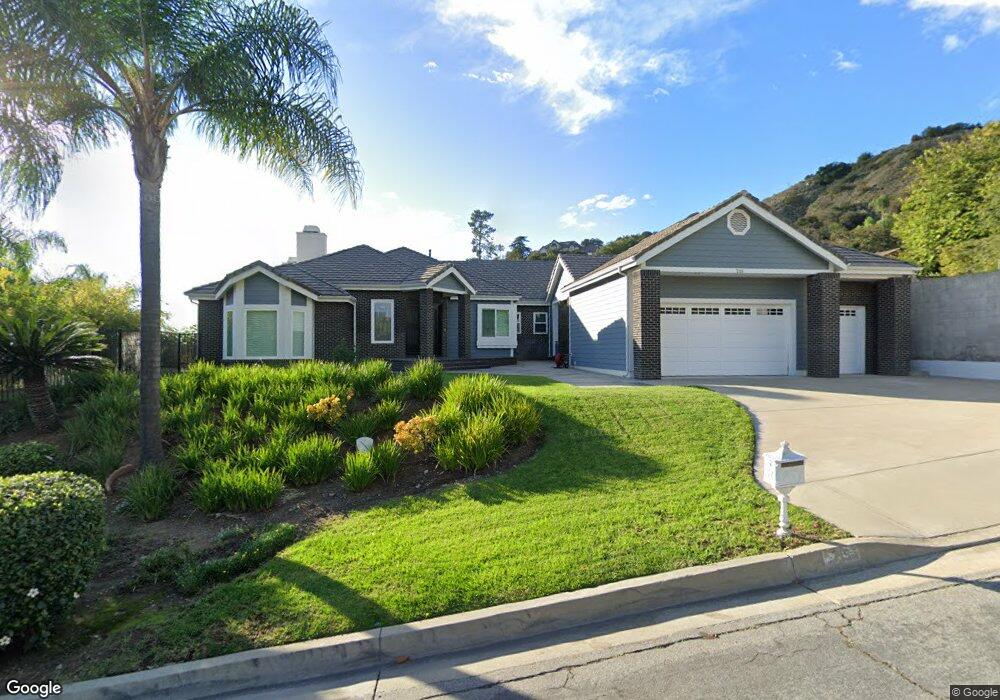
715 N Yucca Ridge Rd Glendora, CA 91741
North Glendora NeighborhoodEstimated Value: $1,701,000 - $1,798,000
5
Beds
4
Baths
4,780
Sq Ft
$362/Sq Ft
Est. Value
About This Home
This home is located at 715 N Yucca Ridge Rd, Glendora, CA 91741 and is currently estimated at $1,732,680, approximately $362 per square foot. 715 N Yucca Ridge Rd is a home located in Los Angeles County with nearby schools including La Fetra Elementary School, Sandburg Middle School, and Glendora High School.
Ownership History
Date
Name
Owned For
Owner Type
Purchase Details
Closed on
Jun 7, 2013
Sold by
Can Isa
Bought by
Can Isa and Can Stephanie
Current Estimated Value
Purchase Details
Closed on
Nov 21, 2006
Sold by
Can Mine
Bought by
Can Isa
Create a Home Valuation Report for This Property
The Home Valuation Report is an in-depth analysis detailing your home's value as well as a comparison with similar homes in the area
Home Values in the Area
Average Home Value in this Area
Purchase History
| Date | Buyer | Sale Price | Title Company |
|---|---|---|---|
| Can Isa | -- | None Available | |
| Can Isa | -- | None Available |
Source: Public Records
Tax History Compared to Growth
Tax History
| Year | Tax Paid | Tax Assessment Tax Assessment Total Assessment is a certain percentage of the fair market value that is determined by local assessors to be the total taxable value of land and additions on the property. | Land | Improvement |
|---|---|---|---|---|
| 2025 | $8,558 | $693,291 | $169,955 | $523,336 |
| 2024 | $8,558 | $679,698 | $166,623 | $513,075 |
| 2023 | $8,271 | $666,371 | $163,356 | $503,015 |
| 2022 | $8,116 | $653,305 | $160,153 | $493,152 |
| 2021 | $7,958 | $640,496 | $157,013 | $483,483 |
| 2019 | $7,523 | $621,501 | $152,357 | $469,144 |
| 2018 | $7,269 | $609,316 | $149,370 | $459,946 |
| 2016 | $6,934 | $585,658 | $143,571 | $442,087 |
| 2015 | $6,780 | $576,862 | $141,415 | $435,447 |
| 2014 | $6,763 | $565,563 | $138,645 | $426,918 |
Source: Public Records
Map
Nearby Homes
- 356 N Meyer Ln
- 0 Ben Lomond Ave
- 731 E Orange Blossom Way
- 459 N Barranca Ave
- 349 N Marcile Ave
- 676 E Desert Willow Rd
- 653 E Gardenia Dr
- 627 E Sierra Madre Ave
- 869 E Mountain Way Unit D
- 1033 Elderberry Dr
- 245 Snapdragon Ln
- 870 E Mountain Way Unit D
- 877 Orchid Way
- 865 Orchid Way Unit B
- 160 N Barranca Ave
- 510 E Viewcrest Dr
- 799 Park View Terrace Unit 72
- 514 Fernpark Dr
- 829 E Cassia Ln Unit A
- 816 E Promenade Unit A
- 715 N Yucca Ridge Rd
- 721 N Yucca Ridge Rd
- 1205 W Sierra Madre Ave
- 701 N Yucca Ridge Rd
- 1246 Hicrest Rd
- 1209 W Sierra Madre Ave
- 745 N Yucca Ridge Rd
- 1141 Hicrest Rd
- 1250 Hicrest Rd
- 1213 W Sierra Madre Ave
- 1245 Hicrest Rd
- 1205 Hicrest Rd
- 1131 Hicrest Rd
- 1217 W Sierra Madre Ave
- 1211 Iris Ln
- 1203 Iris Ln
- 1130 Hicrest Rd
- 18625 E Sierra Madre Ave
- 1223 Iris Ln
- 1251 Hicrest Rd