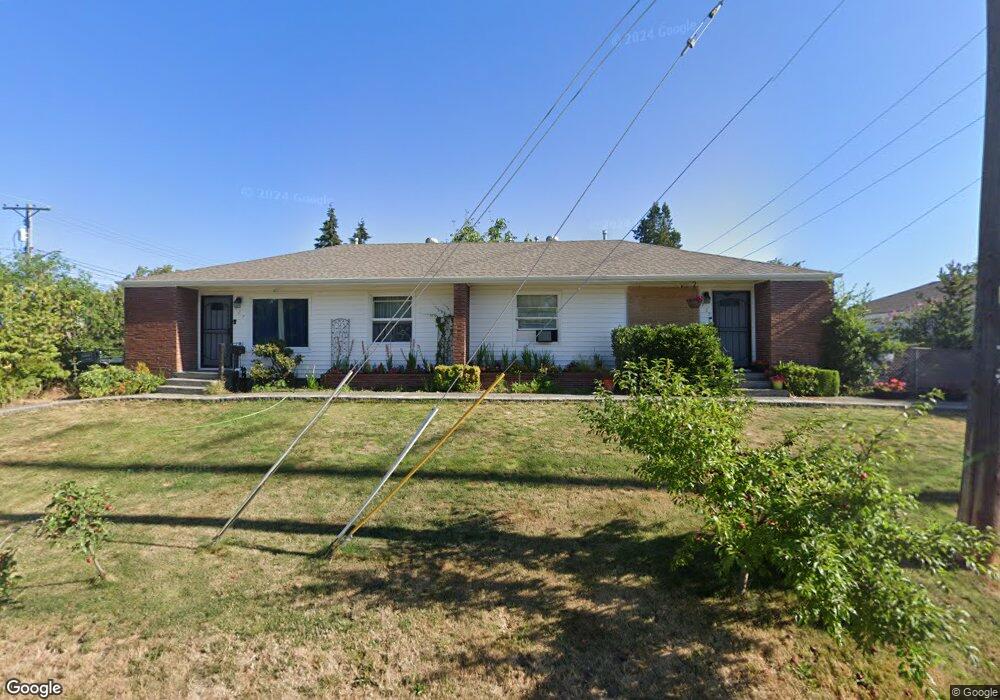
715 S 65th St Unit 717 Tacoma, WA 98408
South End NeighborhoodEstimated Value: $478,000 - $514,000
3
Beds
2
Baths
1,494
Sq Ft
$331/Sq Ft
Est. Value
About This Home
This home is located at 715 S 65th St Unit 717, Tacoma, WA 98408 and is currently estimated at $494,781, approximately $331 per square foot. 715 S 65th St Unit 717 is a home located in Pierce County with nearby schools including Oakland High School, Angelo Giaudrone Middle School, and Mount Tahoma High School.
Ownership History
Date
Name
Owned For
Owner Type
Purchase Details
Closed on
Jun 22, 2018
Sold by
Knapp Teena M
Bought by
Knapp Meredith
Current Estimated Value
Home Financials for this Owner
Home Financials are based on the most recent Mortgage that was taken out on this home.
Original Mortgage
$160,000
Outstanding Balance
$138,373
Interest Rate
4.5%
Mortgage Type
New Conventional
Estimated Equity
$356,408
Purchase Details
Closed on
Feb 26, 2018
Sold by
Knapp Teena M
Bought by
Knapp Teena M
Create a Home Valuation Report for This Property
The Home Valuation Report is an in-depth analysis detailing your home's value as well as a comparison with similar homes in the area
Home Values in the Area
Average Home Value in this Area
Purchase History
| Date | Buyer | Sale Price | Title Company |
|---|---|---|---|
| Knapp Meredith | $199,719 | Cw Title | |
| Knapp Teena M | -- | None Available |
Source: Public Records
Mortgage History
| Date | Status | Borrower | Loan Amount |
|---|---|---|---|
| Open | Knapp Meredith | $160,000 |
Source: Public Records
Tax History Compared to Growth
Tax History
| Year | Tax Paid | Tax Assessment Tax Assessment Total Assessment is a certain percentage of the fair market value that is determined by local assessors to be the total taxable value of land and additions on the property. | Land | Improvement |
|---|---|---|---|---|
| 2025 | $4,876 | $468,300 | $188,100 | $280,200 |
| 2024 | $4,876 | $471,100 | $181,200 | $289,900 |
| 2023 | $4,876 | $437,900 | $172,500 | $265,400 |
| 2022 | $3,994 | $420,300 | $161,200 | $259,100 |
| 2021 | $3,662 | $291,200 | $102,600 | $188,600 |
| 2019 | $2,821 | $247,800 | $84,800 | $163,000 |
| 2018 | $2,967 | $216,800 | $68,700 | $148,100 |
| 2017 | $2,511 | $187,700 | $54,900 | $132,800 |
| 2016 | $2,297 | $142,200 | $41,100 | $101,100 |
| 2014 | $1,912 | $132,000 | $38,800 | $93,200 |
| 2013 | $1,912 | $112,900 | $34,100 | $78,800 |
Source: Public Records
Map
Nearby Homes