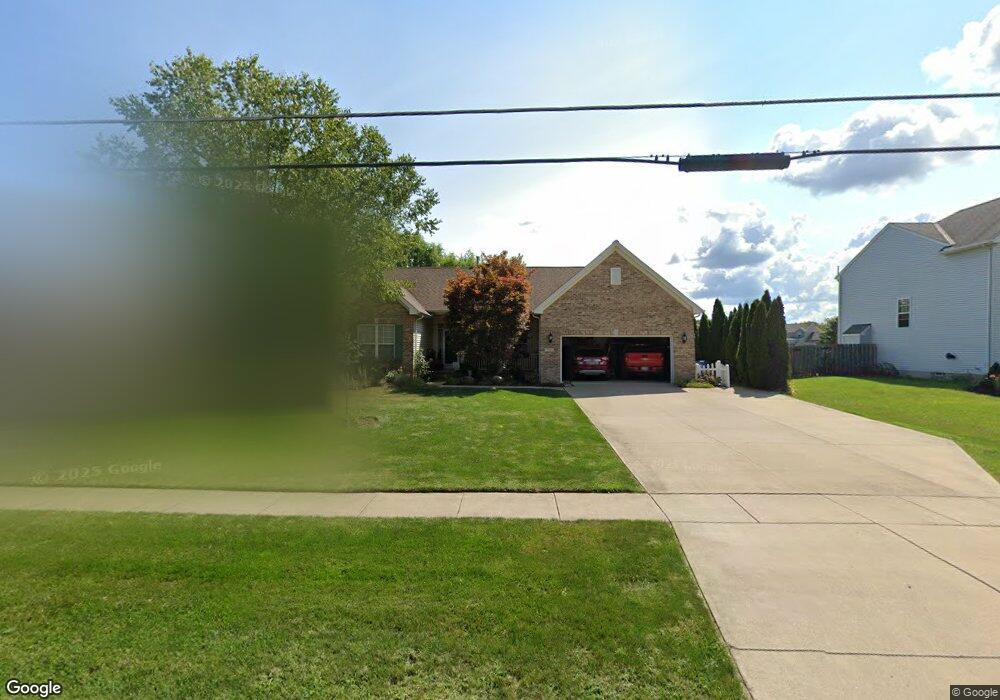
715 S Lake St Amherst, OH 44001
Estimated Value: $336,000 - $409,000
3
Beds
2
Baths
2,063
Sq Ft
$184/Sq Ft
Est. Value
About This Home
This home is located at 715 S Lake St, Amherst, OH 44001 and is currently estimated at $380,525, approximately $184 per square foot. 715 S Lake St is a home located in Lorain County with nearby schools including Powers Elementary School, Walter G. Nord Middle School, and Amherst Junior High School.
Ownership History
Date
Name
Owned For
Owner Type
Purchase Details
Closed on
Aug 20, 2010
Sold by
Kallonen Antti A and Kallonen Holly A
Bought by
Weekley John G and Weekley Lois
Current Estimated Value
Home Financials for this Owner
Home Financials are based on the most recent Mortgage that was taken out on this home.
Original Mortgage
$148,900
Outstanding Balance
$98,735
Interest Rate
4.6%
Mortgage Type
Purchase Money Mortgage
Estimated Equity
$281,790
Purchase Details
Closed on
May 2, 2006
Sold by
K Hovnanian Oster Homes Llc
Bought by
Kallonen Antti A and Lehman Holly A
Home Financials for this Owner
Home Financials are based on the most recent Mortgage that was taken out on this home.
Original Mortgage
$237,000
Interest Rate
6.56%
Mortgage Type
Purchase Money Mortgage
Purchase Details
Closed on
Aug 2, 2005
Sold by
Oster Construction Inc
Bought by
K Hovnanian Oster Homes Llc
Create a Home Valuation Report for This Property
The Home Valuation Report is an in-depth analysis detailing your home's value as well as a comparison with similar homes in the area
Home Values in the Area
Average Home Value in this Area
Purchase History
| Date | Buyer | Sale Price | Title Company |
|---|---|---|---|
| Weekley John G | $198,900 | None Available | |
| Kallonen Antti A | $249,900 | Millennium Title Agency Ltd | |
| K Hovnanian Oster Homes Llc | -- | -- |
Source: Public Records
Mortgage History
| Date | Status | Borrower | Loan Amount |
|---|---|---|---|
| Open | Weekley John G | $148,900 | |
| Closed | Kallonen Antti A | $237,000 |
Source: Public Records
Tax History Compared to Growth
Tax History
| Year | Tax Paid | Tax Assessment Tax Assessment Total Assessment is a certain percentage of the fair market value that is determined by local assessors to be the total taxable value of land and additions on the property. | Land | Improvement |
|---|---|---|---|---|
| 2024 | $4,583 | $113,495 | $25,900 | $87,595 |
| 2023 | $3,925 | $81,921 | $23,730 | $58,191 |
| 2022 | $3,763 | $81,921 | $23,730 | $58,191 |
| 2021 | $3,772 | $81,921 | $23,730 | $58,191 |
| 2020 | $3,761 | $72,500 | $21,000 | $51,500 |
| 2019 | $3,686 | $72,500 | $21,000 | $51,500 |
| 2018 | $3,625 | $72,500 | $21,000 | $51,500 |
| 2017 | $3,545 | $65,110 | $16,770 | $48,340 |
| 2016 | $3,573 | $65,110 | $16,770 | $48,340 |
| 2015 | $3,553 | $65,110 | $16,770 | $48,340 |
| 2014 | $3,726 | $67,960 | $17,500 | $50,460 |
| 2013 | $3,738 | $67,960 | $17,500 | $50,460 |
Source: Public Records
Map
Nearby Homes
- 658 Nicole Dr
- 814 Valley Dr
- 8030 Pyle South Amherst Rd
- 311 Oak St Unit 311
- 335 Copper Creek
- 621 Van Oaks Dr
- 292 Westwoods
- 302 Westwoods
- 748 Tarry Ln
- 7055 Quarry Rd Unit 33
- 7055 Quarry Rd Unit 8
- 7055 Quarry Rd Unit 95
- 7055 Quarry Rd Unit 440
- 7055 Quarry Rd Unit 43
- 7055 Quarry Rd Unit 178
- 7055 Quarry Rd Unit 98
- 7055 Quarry Rd Unit 370
- 133 Ambleside Way
- 281 English Lakes Blvd Unit 67281
- 48221 Rice Rd
- 713 S Lake St
- 717 S Lake St
- 717 S Lake St
- 317 Falling Water Cir
- 735 S Lake St
- 201 Rivers Edge Dr
- 313 Falling Water Cir
- 321 Falling Water Cir
- 653 Nicole Dr
- 203 Rivers Edge Dr
- 309 Falling Water Cir
- 712 S Lake St
- 718 S Lake St
- 736 S Lake St
- 305 Falling Water Cir
- 659 Nicole Dr
- 301 Falling Water Cir
- 701 S Lake St
- 650 Nicole Dr
- 706 S Lake St