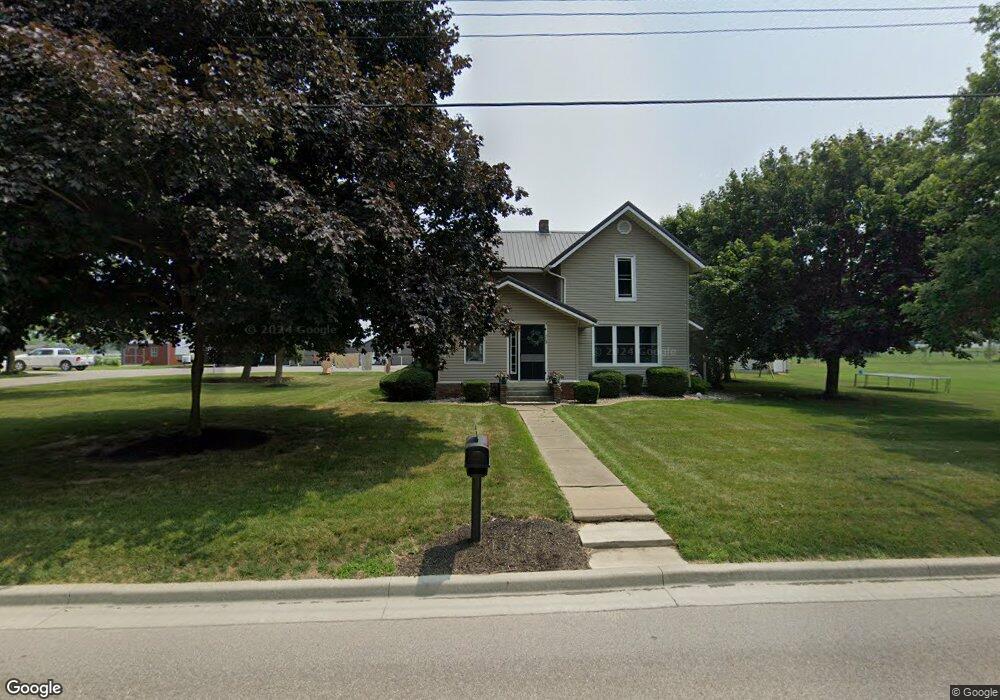
715 S Main St Topeka, IN 46571
Estimated Value: $246,000 - $347,000
3
Beds
1
Bath
1,562
Sq Ft
$192/Sq Ft
Est. Value
About This Home
This home is located at 715 S Main St, Topeka, IN 46571 and is currently estimated at $299,893, approximately $191 per square foot. 715 S Main St is a home located in LaGrange County with nearby schools including Topeka Elementary School, Westview Elementary School, and Westview Junior/Senior High School.
Ownership History
Date
Name
Owned For
Owner Type
Purchase Details
Closed on
Feb 6, 2024
Sold by
Yoder James A and Yoder Brenda L
Bought by
James A Whetstone And Edna M Whetstone Joint and Whetstone
Current Estimated Value
Home Financials for this Owner
Home Financials are based on the most recent Mortgage that was taken out on this home.
Original Mortgage
$70,000
Outstanding Balance
$65,166
Interest Rate
5.87%
Mortgage Type
New Conventional
Estimated Equity
$234,727
Create a Home Valuation Report for This Property
The Home Valuation Report is an in-depth analysis detailing your home's value as well as a comparison with similar homes in the area
Home Values in the Area
Average Home Value in this Area
Purchase History
| Date | Buyer | Sale Price | Title Company |
|---|---|---|---|
| James A Whetstone And Edna M Whetstone Joint | $500,000 | None Listed On Document |
Source: Public Records
Mortgage History
| Date | Status | Borrower | Loan Amount |
|---|---|---|---|
| Open | James A Whetstone And Edna M Whetstone Joint | $70,000 |
Source: Public Records
Tax History Compared to Growth
Tax History
| Year | Tax Paid | Tax Assessment Tax Assessment Total Assessment is a certain percentage of the fair market value that is determined by local assessors to be the total taxable value of land and additions on the property. | Land | Improvement |
|---|---|---|---|---|
| 2024 | $2,776 | $223,700 | $47,100 | $176,600 |
| 2023 | $2,746 | $213,600 | $43,600 | $170,000 |
| 2022 | $2,607 | $195,700 | $38,300 | $157,400 |
| 2021 | $2,526 | $178,400 | $36,300 | $142,100 |
| 2020 | $2,595 | $175,600 | $36,300 | $139,300 |
| 2019 | $2,565 | $174,200 | $36,300 | $137,900 |
| 2018 | $2,566 | $171,000 | $36,300 | $134,700 |
| 2017 | $2,670 | $172,800 | $36,300 | $136,500 |
| 2016 | $2,434 | $170,300 | $36,300 | $134,000 |
| 2014 | $1,886 | $137,700 | $29,300 | $108,400 |
| 2013 | $1,886 | $138,900 | $29,300 | $109,600 |
Source: Public Records
Map
Nearby Homes