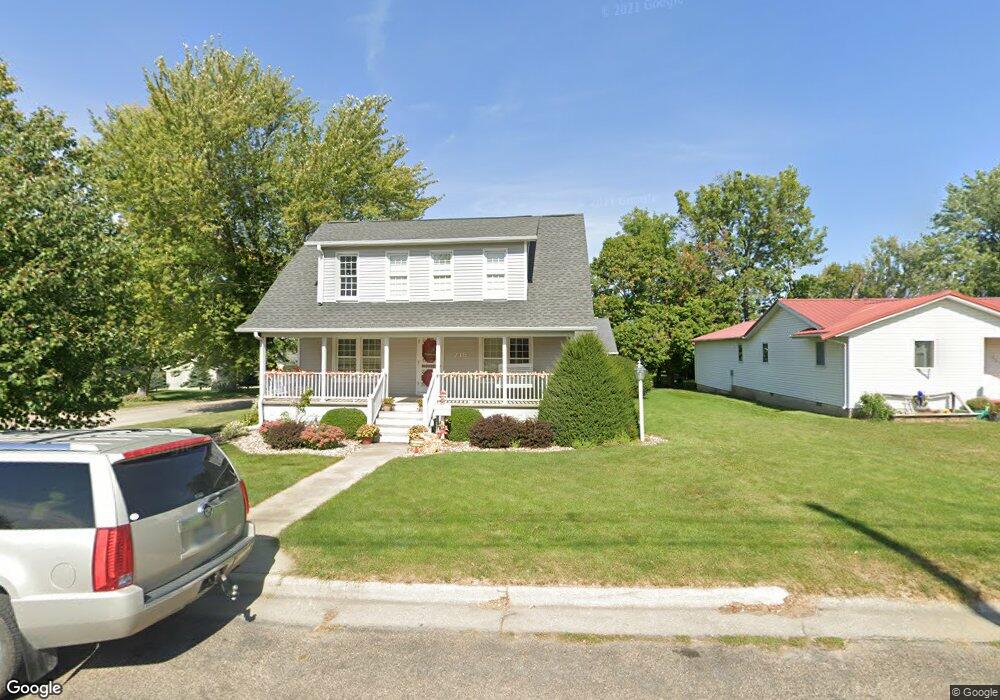
715 W 15th St Vinton, IA 52349
Estimated Value: $162,000 - $200,000
3
Beds
2
Baths
1,272
Sq Ft
$149/Sq Ft
Est. Value
About This Home
This home is located at 715 W 15th St, Vinton, IA 52349 and is currently estimated at $188,966, approximately $148 per square foot. 715 W 15th St is a home located in Benton County with nearby schools including Tilford Elementary School, Shellsburg Elementary School, and Vinton-Shellsburg Middle School.
Ownership History
Date
Name
Owned For
Owner Type
Purchase Details
Closed on
May 13, 2021
Sold by
Whelchel Leon and Whelchel Mary Ann
Bought by
Mcclenning Kendra L
Current Estimated Value
Home Financials for this Owner
Home Financials are based on the most recent Mortgage that was taken out on this home.
Original Mortgage
$16,500
Outstanding Balance
$13,713
Interest Rate
3%
Mortgage Type
New Conventional
Estimated Equity
$175,253
Create a Home Valuation Report for This Property
The Home Valuation Report is an in-depth analysis detailing your home's value as well as a comparison with similar homes in the area
Home Values in the Area
Average Home Value in this Area
Purchase History
| Date | Buyer | Sale Price | Title Company |
|---|---|---|---|
| Mcclenning Kendra L | $165,000 | None Available |
Source: Public Records
Mortgage History
| Date | Status | Borrower | Loan Amount |
|---|---|---|---|
| Open | Mcclenning Kendra L | $16,500 | |
| Open | Mcclenning Kendra L | $148,500 |
Source: Public Records
Tax History Compared to Growth
Tax History
| Year | Tax Paid | Tax Assessment Tax Assessment Total Assessment is a certain percentage of the fair market value that is determined by local assessors to be the total taxable value of land and additions on the property. | Land | Improvement |
|---|---|---|---|---|
| 2025 | $2,762 | $174,800 | $18,500 | $156,300 |
| 2024 | $2,762 | $157,600 | $18,200 | $139,400 |
| 2023 | $2,772 | $157,600 | $18,200 | $139,400 |
| 2022 | $2,304 | $128,800 | $14,500 | $114,300 |
| 2021 | $2,304 | $104,300 | $14,500 | $89,800 |
| 2020 | $1,988 | $104,000 | $11,900 | $92,100 |
| 2019 | $2,000 | $104,000 | $11,900 | $92,100 |
| 2018 | $1,936 | $100,800 | $11,300 | $89,500 |
| 2017 | $1,854 | $103,000 | $11,300 | $91,700 |
| 2016 | $1,818 | $96,300 | $10,600 | $85,700 |
| 2015 | $1,818 | $96,300 | $10,600 | $85,700 |
| 2014 | $1,658 | $88,700 | $0 | $0 |
Source: Public Records
Map
Nearby Homes