Estimated Value: $292,000 - $462,000
3
Beds
2
Baths
1,409
Sq Ft
$291/Sq Ft
Est. Value
About This Home
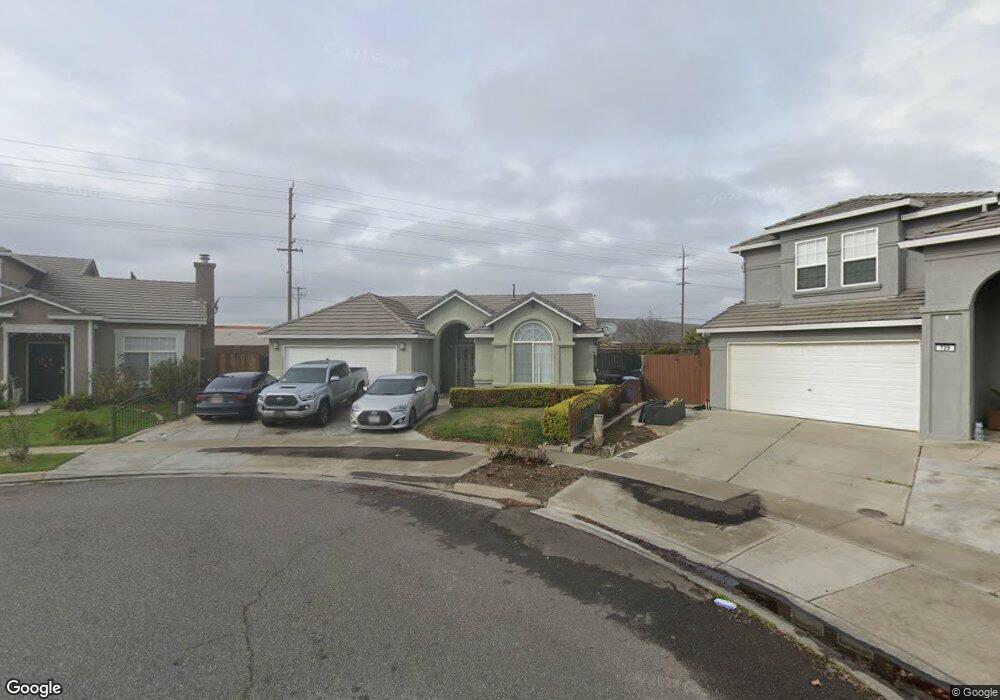
This home is located at 715 Willow Lake Way, Ceres, CA 95307 and is currently estimated at $409,869, approximately $290 per square foot. 715 Willow Lake Way is a home located in Stanislaus County with nearby schools including Sinclear Elementary School, Blaker-Kinser Junior High School, and Central Valley High School.
Ownership History
Date
Name
Owned For
Owner Type
Purchase Details
Closed on
Jan 24, 2001
Sold by
Hanson Donna F
Bought by
Pamatz Rene and Pamatz Maria E
Current Estimated Value
Home Financials for this Owner
Home Financials are based on the most recent Mortgage that was taken out on this home.
Original Mortgage
$152,300
Outstanding Balance
$54,316
Interest Rate
7.08%
Mortgage Type
FHA
Estimated Equity
$355,553
Purchase Details
Closed on
May 5, 1999
Sold by
Barton Roberta F
Bought by
Hanson Donna F
Purchase Details
Closed on
Feb 10, 1997
Sold by
Kimball Hill Homes California Inc
Bought by
Hanson Donna F and Barton Roberta F
Home Financials for this Owner
Home Financials are based on the most recent Mortgage that was taken out on this home.
Original Mortgage
$112,698
Interest Rate
7.85%
Mortgage Type
FHA
Create a Home Valuation Report for This Property
The Home Valuation Report is an in-depth analysis detailing your home's value as well as a comparison with similar homes in the area
Home Values in the Area
Average Home Value in this Area
Purchase History
| Date | Buyer | Sale Price | Title Company |
|---|---|---|---|
| Pamatz Rene | $154,500 | Fidelity National Title Co | |
| Hanson Donna F | -- | -- | |
| Hanson Donna F | $114,500 | Chicago Title Co |
Source: Public Records
Mortgage History
| Date | Status | Borrower | Loan Amount |
|---|---|---|---|
| Open | Pamatz Rene | $152,300 | |
| Previous Owner | Hanson Donna F | $112,698 |
Source: Public Records
Tax History Compared to Growth
Tax History
| Year | Tax Paid | Tax Assessment Tax Assessment Total Assessment is a certain percentage of the fair market value that is determined by local assessors to be the total taxable value of land and additions on the property. | Land | Improvement |
|---|---|---|---|---|
| 2025 | $2,806 | $232,788 | $67,797 | $164,991 |
| 2024 | $2,634 | $228,224 | $66,468 | $161,756 |
| 2023 | $2,563 | $223,750 | $65,165 | $158,585 |
| 2022 | $2,541 | $219,364 | $63,888 | $155,476 |
| 2021 | $2,516 | $215,064 | $62,636 | $152,428 |
| 2020 | $2,440 | $212,860 | $61,994 | $150,866 |
| 2019 | $2,424 | $208,687 | $60,779 | $147,908 |
| 2018 | $2,375 | $204,596 | $59,588 | $145,008 |
| 2017 | $2,356 | $200,585 | $58,420 | $142,165 |
| 2016 | $2,309 | $196,653 | $57,275 | $139,378 |
| 2015 | $2,606 | $193,700 | $56,415 | $137,285 |
| 2014 | $2,423 | $177,500 | $45,000 | $132,500 |
Source: Public Records
Map
Nearby Homes
- 3096 Castle Rock Ct
- 926 Alcoy Dr
- 2873 Malik Ave
- 2677 Ocaso Way
- 2617 E Whitmore Ave
- 1197 Edith Ct
- 3116 Larrynell Dr
- 304 Kirbys Mill Dr
- 3501 Soda Canyon Dr
- 140 Algen Ave
- 421 Kirbys Mill Dr
- 1429 Don Pedro Rd
- 1432 Don Pedro Rd
- 405 Algen Ct
- 3005 Willetts Way
- 624 Park Hurst Way
- 1279 Montclaire Dr
- 1628 Sungate Dr
- 1255 Montclaire Dr
- 505 Mount Everest Ct
- 729 Willow Lake Way
- 3015 Kimball Hill Dr
- 754 Allacante Dr
- 743 Willow Lake Way
- 3029 Kimball Hill Dr
- 768 Allacante Dr
- 757 Willow Lake Way
- 3043 Kimball Hill Dr
- 2943 Paris Way
- 782 Allacante Dr
- 740 Willow Lake Way
- 771 Willow Lake Way
- 3057 Kimball Hill Dr
- 754 Willow Lake Way
- 796 Allacante Dr
- 2929 Paris Way
- 3054 Kimball Hill Dr
- 768 Willow Lake Way
- 785 Willow Lake Way
- 3071 Kimball Hill Dr