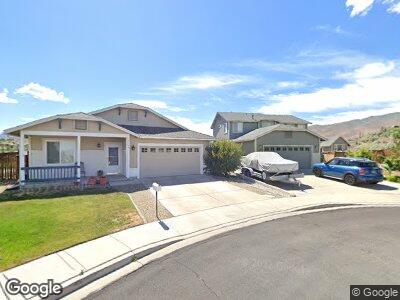
7150 Summer View Ct Reno, NV 89523
Northgate NeighborhoodEstimated Value: $582,634 - $646,000
3
Beds
3
Baths
1,794
Sq Ft
$347/Sq Ft
Est. Value
About This Home
This home is located at 7150 Summer View Ct, Reno, NV 89523 and is currently estimated at $622,159, approximately $346 per square foot. 7150 Summer View Ct is a home located in Washoe County with nearby schools including B D Billinghurst Middle School, Robert McQueen High School, and Riverview Christian Academy.
Ownership History
Date
Name
Owned For
Owner Type
Purchase Details
Closed on
Jan 5, 2005
Sold by
Andre Robert
Bought by
Miller Rosemary
Current Estimated Value
Purchase Details
Closed on
Apr 1, 2003
Sold by
Hanley Dudley J and Hanley Janet F
Bought by
Andre Robert and Miller Rosemary
Home Financials for this Owner
Home Financials are based on the most recent Mortgage that was taken out on this home.
Original Mortgage
$206,400
Interest Rate
5.73%
Purchase Details
Closed on
Jan 27, 1999
Sold by
Bailey and Bailey Mcgah
Bought by
Hanley Dudley J and Hanley Janet F
Home Financials for this Owner
Home Financials are based on the most recent Mortgage that was taken out on this home.
Original Mortgage
$138,400
Interest Rate
6.63%
Create a Home Valuation Report for This Property
The Home Valuation Report is an in-depth analysis detailing your home's value as well as a comparison with similar homes in the area
Home Values in the Area
Average Home Value in this Area
Purchase History
| Date | Buyer | Sale Price | Title Company |
|---|---|---|---|
| Miller Rosemary | -- | -- | |
| Andre Robert | $258,000 | Stewart Title Of Northern Nv | |
| Hanley Dudley J | $174,000 | Stewart Title Company |
Source: Public Records
Mortgage History
| Date | Status | Borrower | Loan Amount |
|---|---|---|---|
| Open | Andre Robert | $28,900 | |
| Open | Andre Robert | $232,000 | |
| Closed | Andre Robert | $206,400 | |
| Previous Owner | Hanley Dudley J | $138,400 | |
| Closed | Andre Robert | $51,600 |
Source: Public Records
Tax History Compared to Growth
Tax History
| Year | Tax Paid | Tax Assessment Tax Assessment Total Assessment is a certain percentage of the fair market value that is determined by local assessors to be the total taxable value of land and additions on the property. | Land | Improvement |
|---|---|---|---|---|
| 2025 | $3,438 | $105,111 | $36,645 | $68,466 |
| 2024 | $3,183 | $100,636 | $31,360 | $69,276 |
| 2023 | $3,183 | $101,315 | $35,700 | $65,615 |
| 2022 | $2,947 | $83,766 | $29,050 | $54,716 |
| 2021 | $2,729 | $78,533 | $24,010 | $54,523 |
| 2020 | $2,567 | $77,475 | $22,750 | $54,725 |
| 2019 | $2,498 | $75,353 | $22,400 | $52,953 |
| 2018 | $2,422 | $69,588 | $17,603 | $51,985 |
| 2017 | $2,353 | $68,560 | $16,427 | $52,133 |
| 2016 | $2,290 | $67,031 | $13,928 | $53,103 |
| 2015 | $2,289 | $65,642 | $12,495 | $53,147 |
| 2014 | $2,222 | $60,869 | $9,776 | $51,093 |
| 2013 | -- | $58,753 | $8,416 | $50,337 |
Source: Public Records
Map
Nearby Homes
- 1055 Udowski Unit Homesite 53
- 1025 Udowski Unit Homesite 56
- 0 Unit 250003854
- 1450 Crosswater Dr
- 2018 Cradle Mountain Dr Unit 2
- 1883 Cambridge Hills Ct
- 7609 Stone Bluff Way
- 7280 Brockway Ct
- 1845 Dove Mountain Ct
- 6700 Sandia Dr Unit 14A
- 7770 Town Square Way
- 1678 Glen Oaks Dr
- 1663 Shadow Wood Ct
- 00 Painted River Trail
- 1522 River Hill Way Unit Homesite 48
- 7735 Harvest Hill Ln
- 1526 River Hill Way Unit Homesite 47
- 1080 Udowski Unit Homesite 62
- 2350 Almond Creek Dr
- 1070 Udowski Unit Homesite 61
- 7150 Summer View Ct
- 7140 Summer View Ct
- 7140 Sunriver Ct
- 7130 Sunriver Ct
- 7150 Sunriver Ct
- 7130 Summer View Ct
- 1801 Saturno Heights Dr
- 1811 Saturno Heights Dr
- 7141 Sunriver Ct
- 7120 Summer View Ct
- 1821 Saturno Heights Dr
- 7110 Summer View Ct
- 7100 Summer View Ct
- 7131 Sunriver Ct
- 7121 Sunriver Ct
- 7111 Sunriver Ct
- 1800 Saturno Heights Dr
- 1781 Saturno Heights Dr
- 7101 Sunriver Ct
- 1810 Saturno Heights Dr