7150 Sundown Rd Winnemucca, NV 89445
Estimated Value: $195,700 - $281,000
--
Bed
--
Bath
960
Sq Ft
$238/Sq Ft
Est. Value
About This Home
This home is located at 7150 Sundown Rd, Winnemucca, NV 89445 and is currently estimated at $228,425, approximately $237 per square foot. 7150 Sundown Rd is a home located in Humboldt County with nearby schools including Grass Valley Elementary School, Winnemucca Junior High School, and French Ford Middle School.
Ownership History
Date
Name
Owned For
Owner Type
Purchase Details
Closed on
Jul 31, 2024
Sold by
Steven M Brown Family Trust and Brown Steven M
Bought by
Teninty Traci L
Current Estimated Value
Home Financials for this Owner
Home Financials are based on the most recent Mortgage that was taken out on this home.
Original Mortgage
$160,000
Outstanding Balance
$159,896
Interest Rate
6.87%
Mortgage Type
Seller Take Back
Estimated Equity
$68,529
Purchase Details
Closed on
Nov 29, 2007
Sold by
Brown Steven M and Brown Teya A
Bought by
Brown Steven M and The Steven M Brown Family Trust
Home Financials for this Owner
Home Financials are based on the most recent Mortgage that was taken out on this home.
Original Mortgage
$97,400
Interest Rate
6.36%
Purchase Details
Closed on
Nov 15, 2007
Sold by
Bridges James P
Bought by
Brown Steven M and Brown Teya A
Home Financials for this Owner
Home Financials are based on the most recent Mortgage that was taken out on this home.
Original Mortgage
$97,400
Interest Rate
6.36%
Create a Home Valuation Report for This Property
The Home Valuation Report is an in-depth analysis detailing your home's value as well as a comparison with similar homes in the area
Home Values in the Area
Average Home Value in this Area
Purchase History
| Date | Buyer | Sale Price | Title Company |
|---|---|---|---|
| Teninty Traci L | $167,000 | None Listed On Document | |
| Brown Steven M | -- | First American Title Insuran | |
| Brown Steven M | $114,900 | First American Title Insuran |
Source: Public Records
Mortgage History
| Date | Status | Borrower | Loan Amount |
|---|---|---|---|
| Open | Teninty Traci L | $160,000 | |
| Previous Owner | Brown Steven M | $97,400 |
Source: Public Records
Tax History Compared to Growth
Tax History
| Year | Tax Paid | Tax Assessment Tax Assessment Total Assessment is a certain percentage of the fair market value that is determined by local assessors to be the total taxable value of land and additions on the property. | Land | Improvement |
|---|---|---|---|---|
| 2025 | $679 | $25,391 | $6,125 | $19,266 |
| 2024 | $662 | $26,064 | $6,125 | $19,939 |
| 2023 | $662 | $25,164 | $6,125 | $19,039 |
| 2022 | $630 | $22,646 | $6,125 | $16,521 |
| 2021 | $634 | $22,820 | $6,125 | $16,695 |
| 2020 | $612 | $21,849 | $4,550 | $17,299 |
| 2019 | $603 | $21,444 | $4,550 | $16,894 |
| 2018 | $600 | $21,342 | $4,550 | $16,792 |
| 2017 | $606 | $21,588 | $4,550 | $17,038 |
| 2016 | $622 | $22,667 | $4,550 | $18,117 |
| 2015 | $632 | $22,545 | $4,375 | $18,170 |
| 2014 | $632 | $22,468 | $4,375 | $18,093 |
Source: Public Records
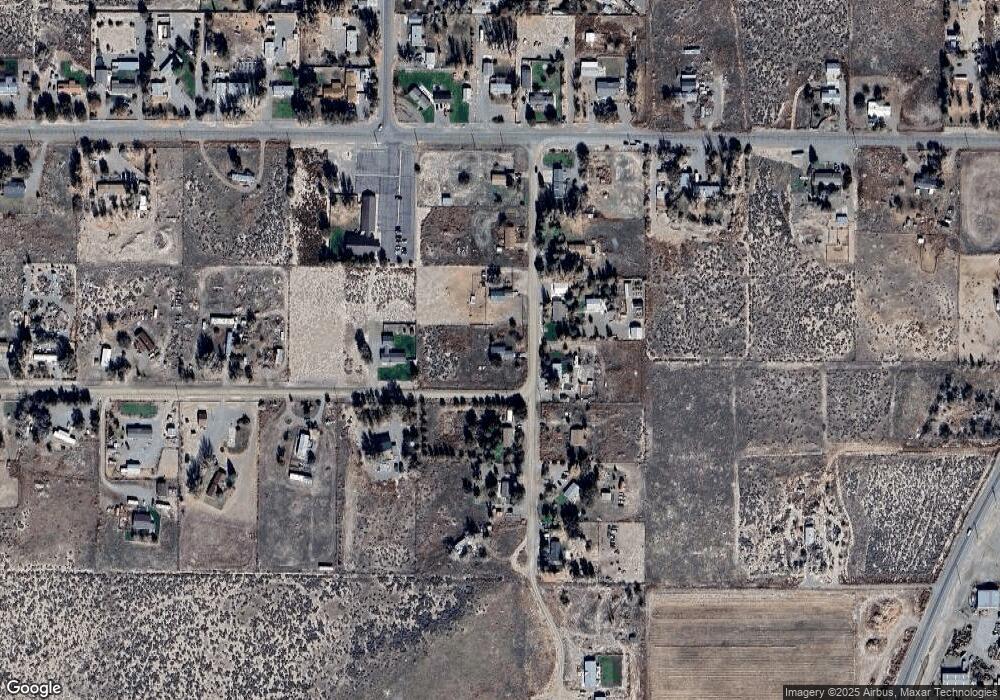
Map
Nearby Homes
- 4220 Alloy Ct
- 6530 Bonanza Dr
- 4260 Bonanza Cir
- 4140 Bonanza Cir
- 0 Westmoreland Rd
- 6305 Silver Knolls Ct
- 6295 Nugget Dr
- 6240 Bonanza Dr
- 6245 Prospect Ave
- 3160 Mars Ave
- 4120 Jupiter St
- 7650 Grass Valley Rd
- 7375 Allen Rd
- 4080 Golden Circle Dr
- 6140 Venus St
- 3065 Mars Ave
- 7900 Sunset Dr
- 3110 Mercury Ave
- 4370 W Commander Dr
- APN 10045181 Germain Dr
- 7110 Sundown Rd
- 7155 Sundown Rd
- 7115 Sundown Rd
- 7200 Sundown Rd
- 7070 Sundown Rd
- 7205 Sundown Rd
- 7240 Sundown Rd
- 7075 Sundown Rd
- 7245 Sundown Rd
- 7030 Sundown Rd
- 7035 Sundown Rd
- 7285 Sundown Rd
- 4015 W Thomas Canyon Rd
- 3270 W Thomas Canyon Rd
- 4085 W Thomas Canyon Rd
- 4035 W Thomas Canyon Rd
- 4005 W Thomas Canyon Rd
- 4165 W Thomas Canyon Rd
- 4230 Rainbow Rd
- 3305 W Thomas Canyon Rd