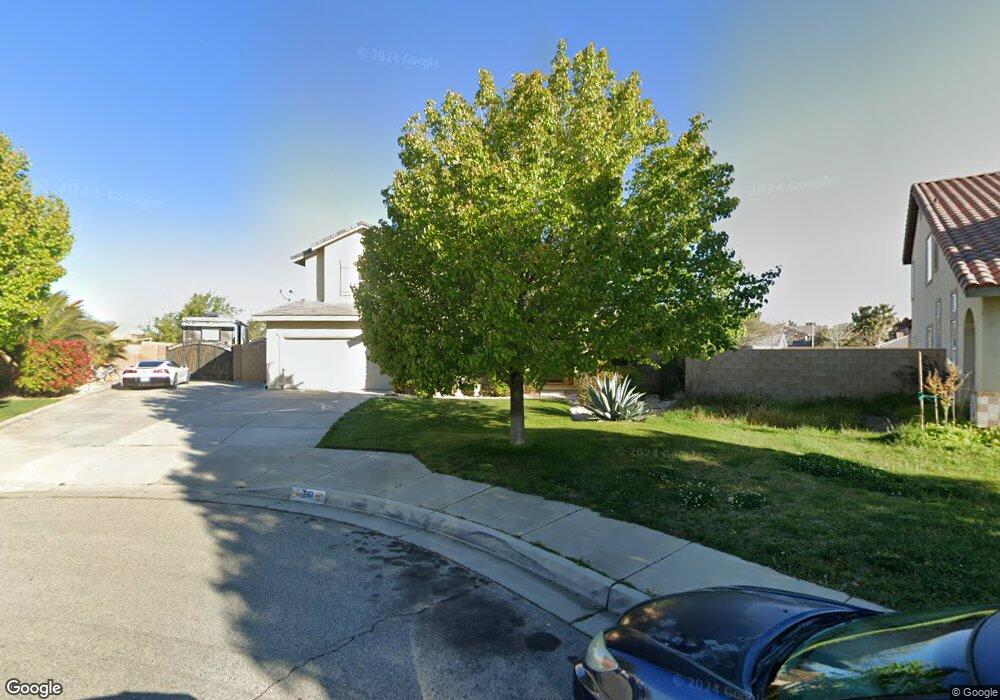
7151 W Avenue l2 Lancaster, CA 93536
West Lancaster NeighborhoodEstimated Value: $657,000 - $703,545
5
Beds
4
Baths
3,650
Sq Ft
$185/Sq Ft
Est. Value
About This Home
This home is located at 7151 W Avenue l2, Lancaster, CA 93536 and is currently estimated at $675,386, approximately $185 per square foot. 7151 W Avenue l2 is a home located in Los Angeles County with nearby schools including Del Sur Senior Elementary School, Quartz Hill High School, and Fabunni Private School Inc..
Ownership History
Date
Name
Owned For
Owner Type
Purchase Details
Closed on
Sep 2, 2020
Sold by
Tinagon Rattanaklao and Mclucas Steven D
Bought by
Tinagon Rattanaklao and Mclucas Steven D
Current Estimated Value
Home Financials for this Owner
Home Financials are based on the most recent Mortgage that was taken out on this home.
Original Mortgage
$386,000
Outstanding Balance
$342,549
Interest Rate
2.9%
Mortgage Type
New Conventional
Estimated Equity
$332,837
Purchase Details
Closed on
May 6, 2017
Sold by
Tinagon Rattanaklao
Bought by
Tinagon Rattanaklao and Mclucas Steven D
Purchase Details
Closed on
Oct 22, 2011
Sold by
Blanchard Stephen R and Tinagon Rattanaklao
Bought by
Tinagon Rattanaklao
Purchase Details
Closed on
Jul 17, 2007
Sold by
Richmond American Homes Of Ca Inc
Bought by
Blanchard Steven R and Tinagon Rattanklao
Home Financials for this Owner
Home Financials are based on the most recent Mortgage that was taken out on this home.
Original Mortgage
$337,246
Interest Rate
6.2%
Mortgage Type
Purchase Money Mortgage
Create a Home Valuation Report for This Property
The Home Valuation Report is an in-depth analysis detailing your home's value as well as a comparison with similar homes in the area
Home Values in the Area
Average Home Value in this Area
Purchase History
| Date | Buyer | Sale Price | Title Company |
|---|---|---|---|
| Tinagon Rattanaklao | -- | Orange Coast Title Company | |
| Tinagon Rattanaklao | -- | None Available | |
| Tinagon Rattanaklao | -- | None Available | |
| Blanchard Steven R | $375,000 | Fidelity National Title Co |
Source: Public Records
Mortgage History
| Date | Status | Borrower | Loan Amount |
|---|---|---|---|
| Open | Tinagon Rattanaklao | $386,000 | |
| Previous Owner | Blanchard Steven R | $337,246 |
Source: Public Records
Tax History
| Year | Tax Paid | Tax Assessment Tax Assessment Total Assessment is a certain percentage of the fair market value that is determined by local assessors to be the total taxable value of land and additions on the property. | Land | Improvement |
|---|---|---|---|---|
| 2025 | $9,843 | $492,157 | $123,461 | $368,696 |
| 2024 | $9,843 | $482,508 | $121,041 | $361,467 |
| 2023 | $9,718 | $473,048 | $118,668 | $354,380 |
| 2022 | $9,411 | $463,774 | $116,342 | $347,432 |
| 2021 | $8,899 | $454,681 | $114,061 | $340,620 |
| 2020 | $8,779 | $450,020 | $112,892 | $337,128 |
| 2019 | $8,635 | $441,197 | $110,679 | $330,518 |
| 2018 | $8,502 | $432,547 | $108,509 | $324,038 |
| 2016 | $7,609 | $385,000 | $96,600 | $288,400 |
| 2015 | $7,568 | $385,000 | $96,600 | $288,400 |
| 2014 | $6,693 | $312,000 | $78,300 | $233,700 |
Source: Public Records
Map
Nearby Homes
- 0 W Avenue L-2
- 4858 W Avenue L-2
- 42570 72nd St W
- 2000 Avenue L-4
- 0 Cor Ave L Pav 70th Stw Unit 22008217
- 42437 71st St W
- 42428 Camden Way
- 42339 Round Hill Dr
- 42344 Camden Way
- 42323 Grandeur Way
- 42328 71st St W
- 0 W Avenue A-12 Unit 24-423019
- 42252 Blueflax Ave
- 42060 Parkmont Dr
- 42041 Mohave Rose Dr
- 42060 Jenny Ln
- 6608 Teasdale St
- 7229 Columbia Way
- 7252 Sandpiper Dr
- 7237 Ojai Dr
- 7154 W Avenue l2
- 7145 W Avenue l2
- 7158 Lyric Ave
- 7142 Lyric Ave
- 7137 W Avenue l2
- 7152 W Avenue l2
- 7146 W Avenue l2
- 7134 Lyric Ave
- 7129 W Avenue l2
- 7136 W Avenue l2
- 7126 Lyric Ave
- 7151 La Sarra Dr
- 7155 Lyric Ave
- 7147 Lyric Ave
- 7128 W Avenue l2
- 7145 La Sarra Dr
- 7141 Lyric Ave
- 7121 W Avenue l2
- 7118 Lyric Ave
- 7137 La Sarra Dr
Your Personal Tour Guide
Ask me questions while you tour the home.