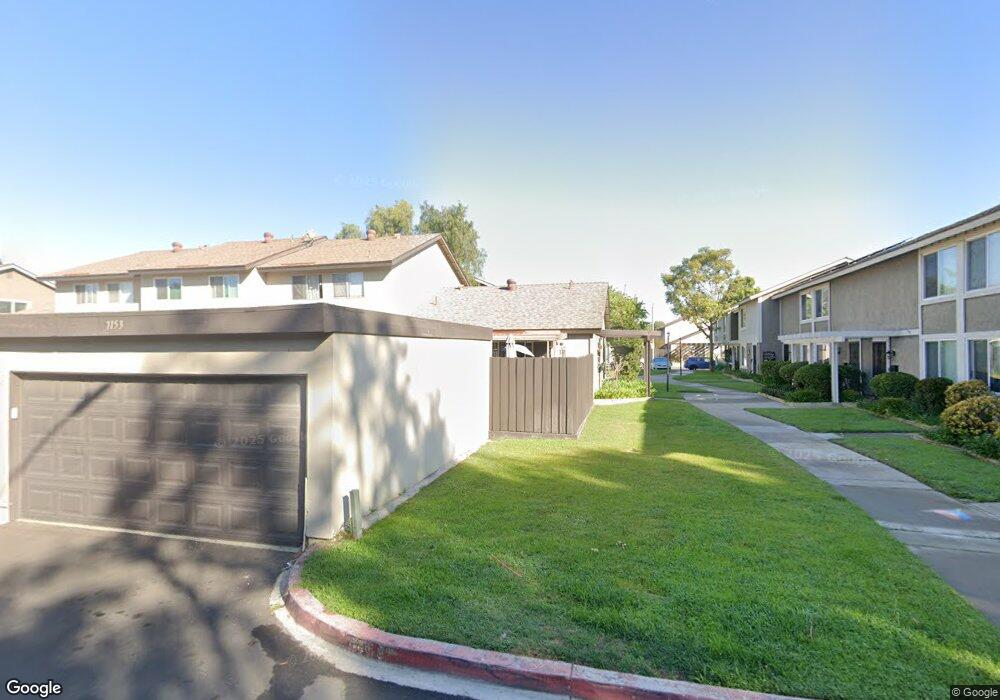
7153 Fulton Way Stanton, CA 90680
Estimated Value: $572,196 - $649,000
2
Beds
1
Bath
850
Sq Ft
$734/Sq Ft
Est. Value
About This Home
This home is located at 7153 Fulton Way, Stanton, CA 90680 and is currently estimated at $624,299, approximately $734 per square foot. 7153 Fulton Way is a home located in Orange County with nearby schools including Bryant Elementary School, Hilton D. Bell Intermediate School, and Pacifica High School.
Ownership History
Date
Name
Owned For
Owner Type
Purchase Details
Closed on
Jun 7, 2007
Sold by
Huerta Nicholas M
Bought by
Huerta Cheryl E
Current Estimated Value
Purchase Details
Closed on
May 4, 2007
Sold by
Landreth Shannon
Bought by
Huerta Cheryl E
Purchase Details
Closed on
Apr 24, 2003
Sold by
Parsons Cheryl
Bought by
Landreth Shannon
Home Financials for this Owner
Home Financials are based on the most recent Mortgage that was taken out on this home.
Original Mortgage
$88,000
Interest Rate
4.87%
Mortgage Type
Purchase Money Mortgage
Purchase Details
Closed on
Jul 15, 1997
Sold by
Barkeloo Mary S and Barkeloo Kenneth R
Bought by
Parsons Cheryl and Landreth Shannon
Home Financials for this Owner
Home Financials are based on the most recent Mortgage that was taken out on this home.
Original Mortgage
$84,918
Interest Rate
7.58%
Mortgage Type
FHA
Create a Home Valuation Report for This Property
The Home Valuation Report is an in-depth analysis detailing your home's value as well as a comparison with similar homes in the area
Home Values in the Area
Average Home Value in this Area
Purchase History
| Date | Buyer | Sale Price | Title Company |
|---|---|---|---|
| Huerta Cheryl E | -- | None Available | |
| Huerta Cheryl E | -- | None Available | |
| Landreth Shannon | -- | Orange Coast Title | |
| Parsons Cheryl | $85,000 | Orange Coast Title |
Source: Public Records
Mortgage History
| Date | Status | Borrower | Loan Amount |
|---|---|---|---|
| Previous Owner | Landreth Shannon | $88,000 | |
| Previous Owner | Parsons Cheryl | $84,918 |
Source: Public Records
Tax History
| Year | Tax Paid | Tax Assessment Tax Assessment Total Assessment is a certain percentage of the fair market value that is determined by local assessors to be the total taxable value of land and additions on the property. | Land | Improvement |
|---|---|---|---|---|
| 2025 | $1,873 | $135,713 | $57,586 | $78,127 |
| 2024 | $1,873 | $133,052 | $56,456 | $76,596 |
| 2023 | $1,834 | $130,444 | $55,349 | $75,095 |
| 2022 | $1,803 | $127,887 | $54,264 | $73,623 |
| 2021 | $1,785 | $125,380 | $53,200 | $72,180 |
| 2020 | $1,762 | $124,095 | $52,655 | $71,440 |
| 2019 | $1,724 | $121,662 | $51,622 | $70,040 |
| 2018 | $1,695 | $119,277 | $50,610 | $68,667 |
| 2017 | $1,670 | $116,939 | $49,618 | $67,321 |
| 2016 | $1,608 | $114,647 | $48,646 | $66,001 |
| 2015 | $1,587 | $112,925 | $47,915 | $65,010 |
| 2014 | $1,539 | $110,713 | $46,976 | $63,737 |
Source: Public Records
Map
Nearby Homes
- 7085 Fulton Way
- 7081 Fulton Way
- 11219 Hood Way
- 7271 Katella Ave Unit 101
- 7271 Katella Ave Unit 99
- 6842 Amelia Way
- 10748 Knott Ave
- 10756 Knott Ave
- 6844 Southampton Dr
- 10700 Knott Ave
- 10684 Bell St
- 11371 Harkers Ct
- 7251 Middlesex Dr
- 7100 Cerritos Ave Unit 86
- 7100 Cerritos Ave Unit 85
- 18 Redwood Ct Unit 18
- 15 Redwood Ct Unit 15
- 10593 Jill St
- 6638 Southampton Dr
- 10780 Elm Cir
- 7151 Fulton Way
- 7149 Fulton Way
- 7145 Fulton Way
- 11105 Emerson Way
- 11101 Emerson Way
- 11090 Marryat Way
- 11097 Emerson Way
- 11109 Emerson Way
- 11095 Emerson Way
- 11086 Marryat Way
- 11093 Emerson Way
- 7143 Fulton Way
- 11082 Marryat Way
- 11085 Emerson Way
- 11081 Emerson Way
- 7141 Fulton Way
- 7139 Fulton Way
- 11091 Marryat Way
- 11085 Marryat Way
- 7137 Fulton Way
Your Personal Tour Guide
Ask me questions while you tour the home.