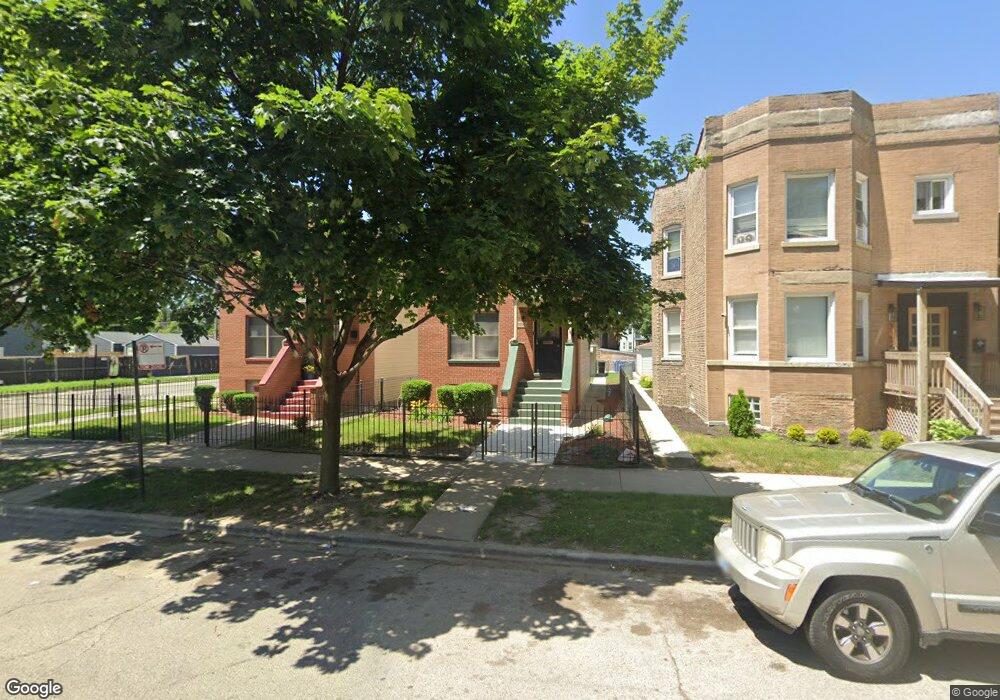
7156 S University Ave Chicago, IL 60619
Grand Crossing NeighborhoodEstimated Value: $212,406 - $271,000
3
Beds
2
Baths
1,680
Sq Ft
$142/Sq Ft
Est. Value
About This Home
This home is located at 7156 S University Ave, Chicago, IL 60619 and is currently estimated at $239,102, approximately $142 per square foot. 7156 S University Ave is a home located in Cook County with nearby schools including Revere Elementary School, Gary Comer College Prep Middle School, and Gary Comer College Prep.
Ownership History
Date
Name
Owned For
Owner Type
Purchase Details
Closed on
Oct 26, 2017
Sold by
Newson Phyllis C
Bought by
Oluewu Isiaka
Current Estimated Value
Home Financials for this Owner
Home Financials are based on the most recent Mortgage that was taken out on this home.
Original Mortgage
$156,610
Outstanding Balance
$131,991
Interest Rate
4.25%
Mortgage Type
FHA
Estimated Equity
$107,111
Purchase Details
Closed on
Apr 20, 2006
Sold by
Revere Community Housing Development Llc
Bought by
Newson Phyllis C
Home Financials for this Owner
Home Financials are based on the most recent Mortgage that was taken out on this home.
Original Mortgage
$135,154
Interest Rate
6.48%
Mortgage Type
Stand Alone First
Purchase Details
Closed on
Jun 8, 2004
Sold by
Lemond Frank E
Bought by
Chicago Title Land Trust Co and Trust #1112761
Purchase Details
Closed on
Jan 2, 2004
Sold by
Orr David D
Bought by
Lemond Frank E
Create a Home Valuation Report for This Property
The Home Valuation Report is an in-depth analysis detailing your home's value as well as a comparison with similar homes in the area
Home Values in the Area
Average Home Value in this Area
Purchase History
| Date | Buyer | Sale Price | Title Company |
|---|---|---|---|
| Oluewu Isiaka | $159,500 | Chicago Title | |
| Newson Phyllis C | $225,000 | Ctic | |
| Chicago Title Land Trust Co | $26,500 | Chicago Title Co | |
| Lemond Frank E | -- | -- |
Source: Public Records
Mortgage History
| Date | Status | Borrower | Loan Amount |
|---|---|---|---|
| Open | Oluewu Isiaka | $156,610 | |
| Previous Owner | Newson Phyllis C | $135,154 |
Source: Public Records
Tax History Compared to Growth
Tax History
| Year | Tax Paid | Tax Assessment Tax Assessment Total Assessment is a certain percentage of the fair market value that is determined by local assessors to be the total taxable value of land and additions on the property. | Land | Improvement |
|---|---|---|---|---|
| 2024 | $2,686 | $21,600 | $3,493 | $18,107 |
| 2023 | $2,587 | $16,000 | $4,851 | $11,149 |
| 2022 | $2,587 | $16,000 | $4,851 | $11,149 |
| 2021 | $2,548 | $15,999 | $4,851 | $11,148 |
| 2020 | $3,556 | $19,067 | $4,269 | $14,798 |
| 2019 | $3,521 | $20,953 | $4,269 | $16,684 |
| 2018 | $4,139 | $20,953 | $4,269 | $16,684 |
| 2017 | $2,715 | $15,989 | $3,881 | $12,108 |
| 2016 | $2,702 | $15,989 | $3,881 | $12,108 |
| 2015 | $2,312 | $15,989 | $3,881 | $12,108 |
| 2014 | $2,085 | $13,806 | $3,104 | $10,702 |
| 2013 | $2,272 | $15,121 | $3,104 | $12,017 |
Source: Public Records
Map
Nearby Homes
- 7146 S University Ave
- 7134 S University Ave
- 7112 S University Ave
- 7117 S University Ave
- 7236 S University Ave
- 7225 S Woodlawn Ave
- 7109 S Dobson Ave
- 1225 E 71st Place
- 1229 E 71st St
- 7124 S Ellis Ave
- 7316 S Woodlawn Ave
- 7335 S Greenwood Ave
- 7337 S University Ave
- 1310 E 72nd St
- 7022 S Kimbark Ave
- 1244 E 70th St
- 6928 S Kimbark Ave
- 7327 S Kenwood Ave
- 7356 S Kenwood Ave
- 7343 S Kenwood Ave
- 7152 S University Ave
- 7152 S University Ave
- 7148 S University Ave
- 7156 S University Ave
- 7158 S University Ave
- 7144 S University Ave
- 7140 S University Ave
- 7157 S Greenwood Ave
- 7147 S Greenwood Ave
- 7136 S University Ave
- 7136 S University Ave
- 7151 S Greenwood Ave
- 7134 S University Ave
- 7134 S University Ave Unit 2
- 7134 S University Ave Unit 1
- 7143 S University Ave
- 7143 S University Ave
- 7145 S Greenwood Ave Unit COACH
- 7145 S Greenwood Ave Unit 201
- 7145 S Greenwood Ave Unit 101