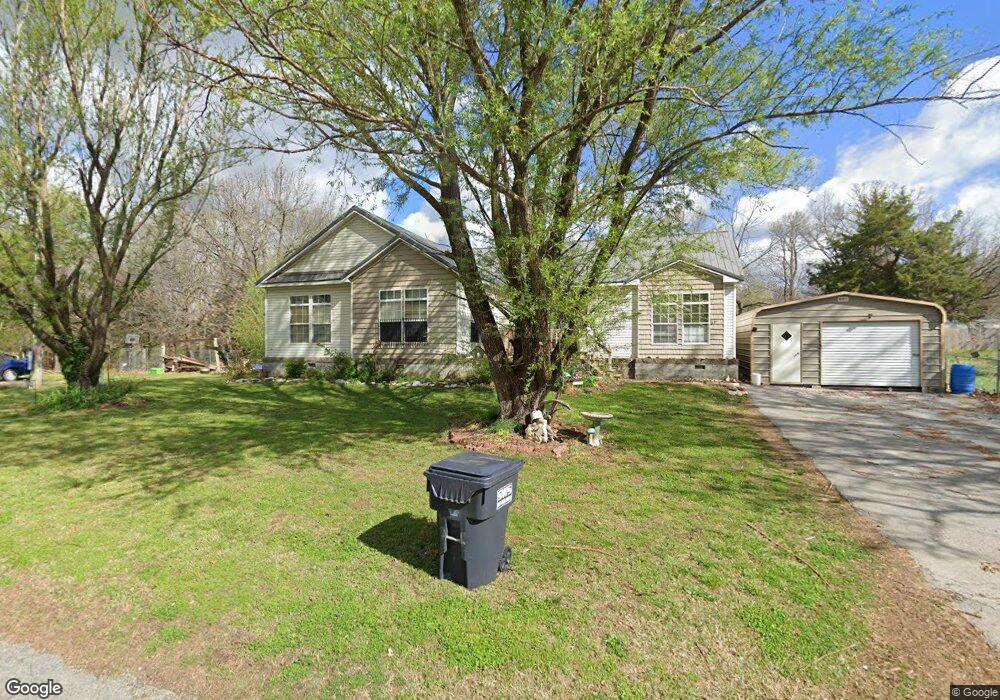
7158 Rolling Hills Dr Seligman, MO 65745
Estimated Value: $206,000 - $308,000
3
Beds
2
Baths
1,900
Sq Ft
$135/Sq Ft
Est. Value
About This Home
This home is located at 7158 Rolling Hills Dr, Seligman, MO 65745 and is currently estimated at $256,751, approximately $135 per square foot. 7158 Rolling Hills Dr is a home located in Barry County with nearby schools including Southwest Elementary School, Southwest Middle School, and Southwest High School.
Ownership History
Date
Name
Owned For
Owner Type
Purchase Details
Closed on
Apr 26, 2016
Sold by
Trent George E and Trent Barbara
Bought by
Jermain Brenda L
Current Estimated Value
Home Financials for this Owner
Home Financials are based on the most recent Mortgage that was taken out on this home.
Original Mortgage
$54,494
Outstanding Balance
$43,480
Interest Rate
3.73%
Mortgage Type
FHA
Estimated Equity
$213,271
Purchase Details
Closed on
Dec 28, 2012
Sold by
Secretary Of Hud
Bought by
Trent George E
Home Financials for this Owner
Home Financials are based on the most recent Mortgage that was taken out on this home.
Original Mortgage
$41,830
Interest Rate
3.35%
Mortgage Type
New Conventional
Purchase Details
Closed on
Oct 5, 2011
Sold by
Citimortgage Inc
Bought by
Secretary Of Hud
Purchase Details
Closed on
Sep 30, 2011
Sold by
Edwards William Howard and Edwards Barbara J
Bought by
Citimortgage Inc
Create a Home Valuation Report for This Property
The Home Valuation Report is an in-depth analysis detailing your home's value as well as a comparison with similar homes in the area
Home Values in the Area
Average Home Value in this Area
Purchase History
| Date | Buyer | Sale Price | Title Company |
|---|---|---|---|
| Jermain Brenda L | -- | None Available | |
| Trent George E | -- | None Available | |
| Secretary Of Hud | -- | None Available | |
| Citimortgage Inc | $118,124 | None Available |
Source: Public Records
Mortgage History
| Date | Status | Borrower | Loan Amount |
|---|---|---|---|
| Open | Jermain Brenda L | $54,494 | |
| Previous Owner | Trent George E | $41,830 |
Source: Public Records
Tax History Compared to Growth
Tax History
| Year | Tax Paid | Tax Assessment Tax Assessment Total Assessment is a certain percentage of the fair market value that is determined by local assessors to be the total taxable value of land and additions on the property. | Land | Improvement |
|---|---|---|---|---|
| 2025 | $4,061 | $26,885 | $3,344 | $23,541 |
| 2024 | $1,282 | $24,966 | $3,344 | $21,622 |
| 2023 | $1,281 | $24,966 | $3,344 | $21,622 |
| 2022 | $1,247 | $24,301 | $2,679 | $21,622 |
| 2021 | $1,253 | $24,301 | $2,679 | $21,622 |
| 2020 | $1,253 | $24,301 | $2,679 | $21,622 |
| 2018 | $1,106 | $22,515 | $2,679 | $19,836 |
| 2017 | $1,104 | $22,515 | $2,679 | $19,836 |
| 2016 | $1,104 | $22,192 | $2,337 | $19,855 |
| 2015 | -- | $22,192 | $2,337 | $19,855 |
| 2014 | -- | $22,192 | $2,337 | $19,855 |
| 2012 | -- | $0 | $0 | $0 |
Source: Public Records
Map
Nearby Homes
- 27669 Ross Rd
- 0000 State Highway Dd
- 7509 Little St
- 000 County Road 837
- 000 Private Road 2274 (6 Acres)
- 000 Private Road 2274
- 28790 Stapleton St
- 32673 State Highway 112
- 32673 State Hwy 12
- 29060 Main St
- 7593 Fr 2265
- Lot 1 Doc Meyer Rd
- Lot 2 Doc Meyer Rd
- 7959 Heritage Heights Rd
- 27418 Farm Road 1090
- 9470 Elsie Corn Ln
- 7593 Farm Road 2265
- 31533 & 31579 State Highway 112
- 31533&3157 State Highway 112
- 17644 State Highway 37
- 1313 W Frost St
- Tbd Xxx Rolling Hills Dr
- 7161 Rolling Hills Dr
- 27889 Eggleston St
- 7201 Rolling Hills Dr
- 7181 Rolling Hills Dr
- 7181 Rolling Hills Dr
- 7256 Rolling Hills Dr
- 7150 Frost St
- 7263 Rolling Hills Dr
- 27727 Eggleston St
- 27939 Westview Rd
- 30643 State Highway 37
- 7449 Farm Road 2280
- 27881 Buckeye St
- 30717 State Highway 37
- 30495 State Highway 37
- 27693 Murphy St
- 7338 Frost St
- 27660 Murphy St