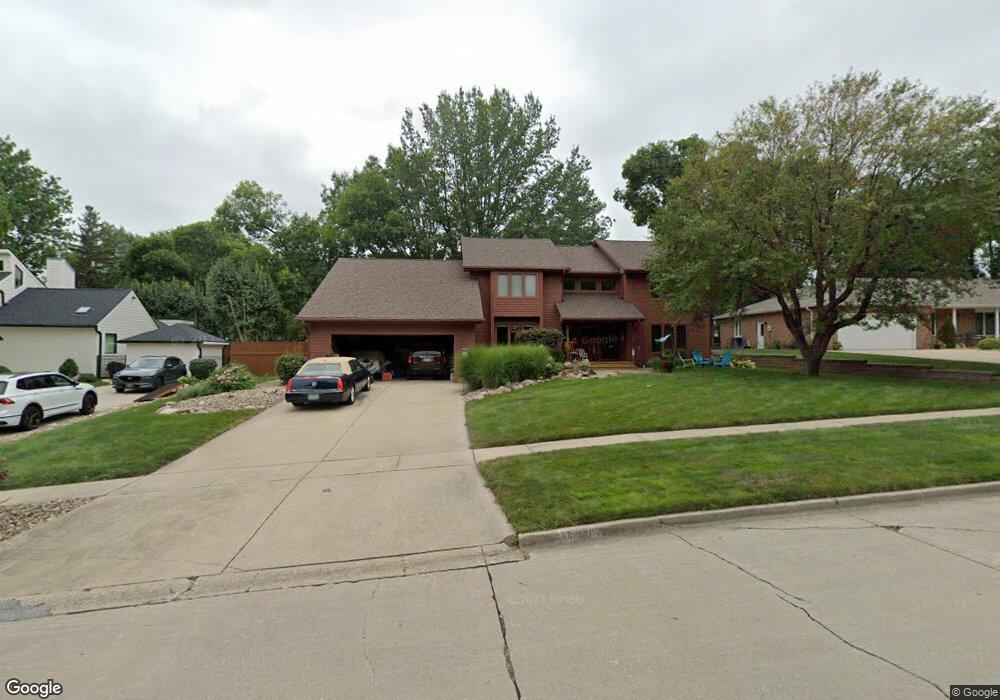
716 38th St West Des Moines, IA 50265
Estimated Value: $505,614 - $616,000
4
Beds
4
Baths
3,002
Sq Ft
$192/Sq Ft
Est. Value
About This Home
This home is located at 716 38th St, West Des Moines, IA 50265 and is currently estimated at $576,154, approximately $191 per square foot. 716 38th St is a home located in Polk County with nearby schools including Western Hills Elementary School, Valley Southwoods Freshman High School, and Stilwell Junior High School.
Ownership History
Date
Name
Owned For
Owner Type
Purchase Details
Closed on
Jun 10, 2006
Sold by
Spade K Stephen and Wagner Amber L
Bought by
Vannimwegen Keith Lee and Van Nimwegen Patricia Jane
Current Estimated Value
Purchase Details
Closed on
Sep 27, 2002
Sold by
Yelick Marsha A and Nickels Bruce J
Bought by
Spade K Stephen
Home Financials for this Owner
Home Financials are based on the most recent Mortgage that was taken out on this home.
Original Mortgage
$236,000
Interest Rate
6.39%
Create a Home Valuation Report for This Property
The Home Valuation Report is an in-depth analysis detailing your home's value as well as a comparison with similar homes in the area
Home Values in the Area
Average Home Value in this Area
Purchase History
| Date | Buyer | Sale Price | Title Company |
|---|---|---|---|
| Vannimwegen Keith Lee | $324,500 | None Available | |
| Spade K Stephen | $294,500 | -- |
Source: Public Records
Mortgage History
| Date | Status | Borrower | Loan Amount |
|---|---|---|---|
| Previous Owner | Spade K Stephen | $236,000 |
Source: Public Records
Tax History Compared to Growth
Tax History
| Year | Tax Paid | Tax Assessment Tax Assessment Total Assessment is a certain percentage of the fair market value that is determined by local assessors to be the total taxable value of land and additions on the property. | Land | Improvement |
|---|---|---|---|---|
| 2025 | $7,550 | $512,300 | $89,200 | $423,100 |
| 2024 | $7,550 | $493,800 | $84,700 | $409,100 |
| 2023 | $7,776 | $493,800 | $84,700 | $409,100 |
| 2022 | $7,682 | $411,600 | $73,200 | $338,400 |
| 2021 | $7,732 | $411,600 | $73,200 | $338,400 |
| 2020 | $7,610 | $394,100 | $70,000 | $324,100 |
| 2019 | $7,386 | $394,100 | $70,000 | $324,100 |
| 2018 | $7,400 | $369,100 | $64,400 | $304,700 |
| 2017 | $7,082 | $369,100 | $64,400 | $304,700 |
| 2016 | $6,922 | $343,500 | $59,000 | $284,500 |
| 2015 | $6,922 | $343,500 | $59,000 | $284,500 |
| 2014 | $6,270 | $318,100 | $53,700 | $264,400 |
Source: Public Records
Map
Nearby Homes