Estimated Value: $310,000 - $349,000
3
Beds
2
Baths
1,051
Sq Ft
$313/Sq Ft
Est. Value
About This Home
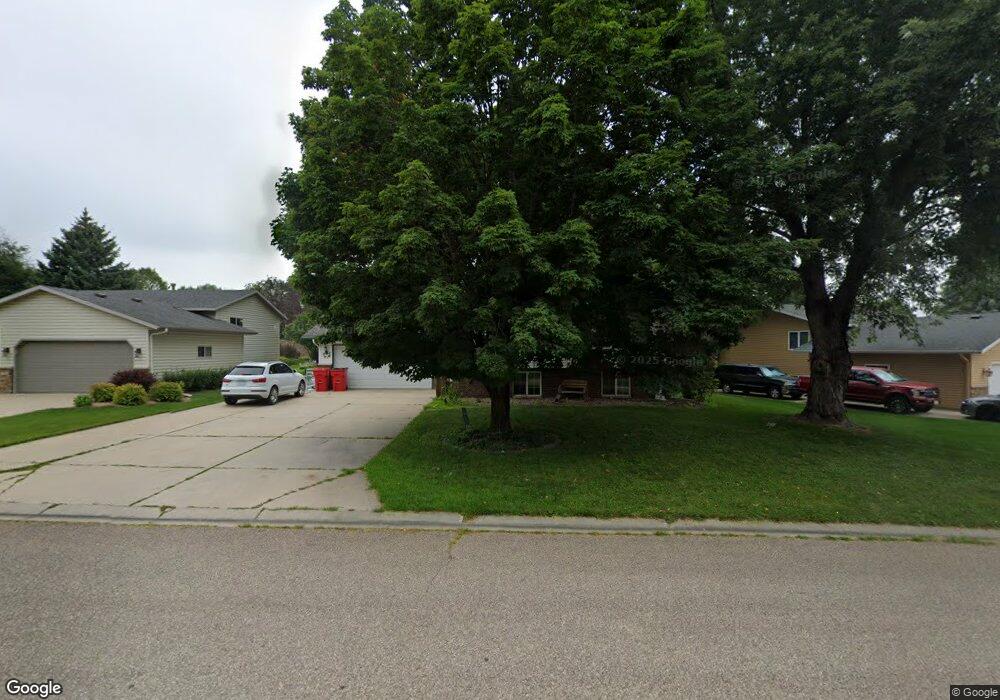
This home is located at 716 3rd Ave NW, Byron, MN 55920 and is currently estimated at $329,243, approximately $313 per square foot. 716 3rd Ave NW is a home located in Olmsted County with nearby schools including Byron Intermediate School, Byron Middle School, and Byron Senior High School.
Ownership History
Date
Name
Owned For
Owner Type
Purchase Details
Closed on
Apr 18, 2016
Sold by
Faulhaber Ted F
Bought by
Faulhaber Courtney and Austin Victor
Current Estimated Value
Home Financials for this Owner
Home Financials are based on the most recent Mortgage that was taken out on this home.
Original Mortgage
$180,976
Outstanding Balance
$143,348
Interest Rate
3.59%
Mortgage Type
New Conventional
Estimated Equity
$185,895
Purchase Details
Closed on
Dec 31, 2014
Sold by
Faulhaber Audrey Joann
Bought by
Faulhaber Ted R
Home Financials for this Owner
Home Financials are based on the most recent Mortgage that was taken out on this home.
Original Mortgage
$157,250
Interest Rate
3.84%
Mortgage Type
New Conventional
Create a Home Valuation Report for This Property
The Home Valuation Report is an in-depth analysis detailing your home's value as well as a comparison with similar homes in the area
Home Values in the Area
Average Home Value in this Area
Purchase History
| Date | Buyer | Sale Price | Title Company |
|---|---|---|---|
| Faulhaber Courtney | $176,000 | Attorney | |
| Faulhaber Ted R | -- | None Available |
Source: Public Records
Mortgage History
| Date | Status | Borrower | Loan Amount |
|---|---|---|---|
| Open | Faulhaber Courtney | $180,976 | |
| Previous Owner | Faulhaber Ted R | $157,250 |
Source: Public Records
Tax History
| Year | Tax Paid | Tax Assessment Tax Assessment Total Assessment is a certain percentage of the fair market value that is determined by local assessors to be the total taxable value of land and additions on the property. | Land | Improvement |
|---|---|---|---|---|
| 2024 | $4,250 | $282,200 | $45,000 | $237,200 |
| 2023 | $4,254 | $280,100 | $45,000 | $235,100 |
| 2022 | $3,584 | $262,400 | $45,000 | $217,400 |
| 2021 | $3,196 | $211,900 | $40,000 | $171,900 |
| 2020 | $2,924 | $202,700 | $40,000 | $162,700 |
| 2019 | $2,754 | $184,100 | $35,000 | $149,100 |
| 2018 | $2,547 | $175,400 | $30,000 | $145,400 |
| 2017 | $2,430 | $168,200 | $30,000 | $138,200 |
| 2016 | $2,240 | $136,400 | $21,400 | $115,000 |
| 2015 | $2,186 | $118,100 | $20,700 | $97,400 |
| 2014 | $2,018 | $119,600 | $20,800 | $98,800 |
| 2012 | -- | $119,300 | $20,769 | $98,531 |
Source: Public Records
Map
Nearby Homes
- 805 1st Ave NW
- 259 Brookmoor Ln NW
- 910 Byron Ave N
- 926 Byron Ave N
- 220 4th St NW
- 713 7th St NW
- 1017 8th Ave NW
- 323 2nd St NW
- 154 Somerby Pkwy NE
- 172 Somerby Pkwy NE
- 509 4th Ave NE
- 190 Somerby Pkwy NE
- 208 Somerby Pkwy NE
- 717 13th St NW
- 226 Somerby Pkwy NE
- 244 Somerby Pkwy NE
- 264 Somerby Pkwy NE
- 1405 Somerby Pkwy NE
- 105 Somerby Pkwy NE
- 1413 Somerby Pkwy NE
- 712 3rd Ave NW
- 720 3rd Ave NW
- 812 3 1/2 Ave NW
- 708 3rd Ave NW
- 808 3 1/2 Ave NW
- 810 3rd Ave NW
- 816 3 1/2 Ave NW
- 816 3 1 2 Ave NW
- 814 814 3rd-Avenue-nw
- 814 3rd Ave NW
- 804 3 1/2 Ave NW
- 704 3rd Ave NW
- 215 7th St NW
- 217 7th St NW
- 215 215 7th-Street-nw
- 800 3 1/2 Ave NW
- 820 3 1/2 Ave NW
- 820 3 1 2 Ave NW
- 211 7th St NW
- 818 3rd Ave NW
Your Personal Tour Guide
Ask me questions while you tour the home.