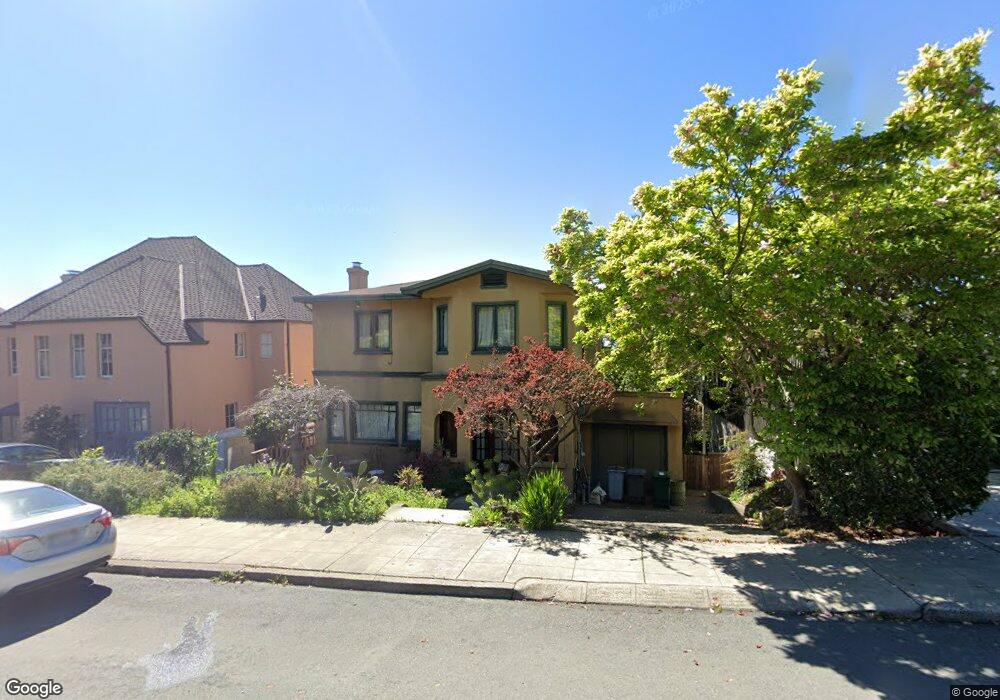
716 Arlington Ave Berkeley, CA 94707
Thousand Oaks NeighborhoodEstimated Value: $2,180,000 - $2,702,000
5
Beds
4
Baths
3,273
Sq Ft
$748/Sq Ft
Est. Value
About This Home
This home is located at 716 Arlington Ave, Berkeley, CA 94707 and is currently estimated at $2,448,039, approximately $747 per square foot. 716 Arlington Ave is a home located in Alameda County with nearby schools including Thousand Oaks Elementary School, Berkeley Arts Magnet at Whittier School, and Ruth Acty Elementary.
Ownership History
Date
Name
Owned For
Owner Type
Purchase Details
Closed on
Feb 21, 2017
Sold by
Haynes Geoffrey W and Haynes Marin Shawn
Bought by
Fitzgerald Haynes Geoffrey Whitford and Fitzgerald Haynes Marin Shawn
Current Estimated Value
Purchase Details
Closed on
Feb 20, 1998
Sold by
Gage Glen W and Gage Elizabeth A
Bought by
Haynes Geoffrey W and Haynes Marin Shawn
Home Financials for this Owner
Home Financials are based on the most recent Mortgage that was taken out on this home.
Original Mortgage
$456,000
Outstanding Balance
$78,936
Interest Rate
6.75%
Estimated Equity
$2,369,103
Purchase Details
Closed on
Sep 19, 1994
Sold by
Kang James C and Kang Lucille
Bought by
Gage Glen W and Gage Elizabeth A
Home Financials for this Owner
Home Financials are based on the most recent Mortgage that was taken out on this home.
Original Mortgage
$300,000
Interest Rate
8.58%
Create a Home Valuation Report for This Property
The Home Valuation Report is an in-depth analysis detailing your home's value as well as a comparison with similar homes in the area
Home Values in the Area
Average Home Value in this Area
Purchase History
| Date | Buyer | Sale Price | Title Company |
|---|---|---|---|
| Fitzgerald Haynes Geoffrey Whitford | -- | None Available | |
| Haynes Geoffrey W | $570,000 | Nortwestern Title Company | |
| Gage Glen W | $435,000 | Placer Title Company |
Source: Public Records
Mortgage History
| Date | Status | Borrower | Loan Amount |
|---|---|---|---|
| Open | Haynes Geoffrey W | $456,000 | |
| Previous Owner | Gage Glen W | $300,000 | |
| Closed | Haynes Geoffrey W | $57,000 |
Source: Public Records
Tax History
| Year | Tax Paid | Tax Assessment Tax Assessment Total Assessment is a certain percentage of the fair market value that is determined by local assessors to be the total taxable value of land and additions on the property. | Land | Improvement |
|---|---|---|---|---|
| 2025 | $18,254 | $917,608 | $273,030 | $651,578 |
| 2024 | $18,254 | $906,483 | $267,678 | $638,805 |
| 2023 | $17,742 | $888,711 | $262,430 | $626,281 |
| 2022 | $17,460 | $871,285 | $257,284 | $614,001 |
| 2021 | $17,464 | $854,203 | $252,240 | $601,963 |
| 2020 | $16,444 | $845,447 | $249,654 | $595,793 |
| 2019 | $15,683 | $828,873 | $244,760 | $584,113 |
| 2018 | $15,349 | $812,624 | $239,962 | $572,662 |
| 2017 | $14,675 | $784,194 | $235,258 | $548,936 |
| 2016 | $14,089 | $768,821 | $230,646 | $538,175 |
| 2015 | $13,861 | $757,273 | $227,182 | $530,091 |
| 2014 | $13,641 | $742,441 | $222,732 | $519,709 |
Source: Public Records
Map
Nearby Homes
- 1983 Yosemite Rd
- 589 San Luis Rd
- 770 Santa Barbara Rd
- 483 Boynton Ave
- 826 Indian Rock Ave
- 479 Kentucky Ave
- 614 Cragmont Ave
- 385 Vermont Ave
- 1563 Thousand Oaks Blvd
- 415 Berkeley Park Blvd
- 225 Arlington Ave
- 255 Stanford Ave
- 290 Colgate Ave
- 890 Keeler Ave
- 201 Amherst Ave
- 265 Purdue Ave
- 1024 Miller Ave
- 141 Saint Albans Rd
- 935 Grizzly Peak Blvd
- 982 Grizzly Peak Blvd
- 708 Arlington Ave
- 722 Arlington Ave
- 700 Arlington Ave
- 726 Arlington Ave
- 1988 Thousand Oaks Blvd
- 1947 Yosemite Rd
- 1945 Yosemite Rd
- 1949 Yosemite Rd
- 732 Arlington Ave
- 1943 Yosemite Rd
- 1974 Thousand Oaks Blvd
- 1951 Yosemite Rd
- 721 Arlington Ave
- 1941 Yosemite Rd
- 738 Arlington Ave
- 729 Arlington Ave
- 711 Arlington Ave
- 715 Arlington Ave
- 1953 Yosemite Rd
- 705 Arlington Ave
Your Personal Tour Guide
Ask me questions while you tour the home.