716 Cajon St Redlands, CA 92373
South Redlands NeighborhoodEstimated Value: $699,000 - $783,339
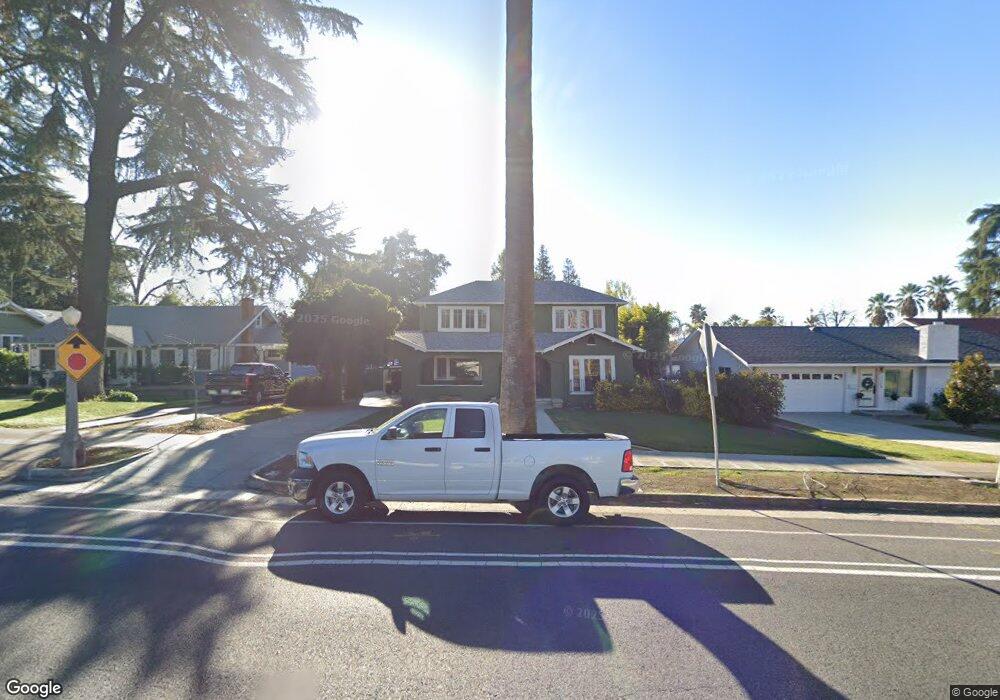
About This Home
This home is located at 716 Cajon St, Redlands, CA 92373 and is currently estimated at $734,335, approximately $350 per square foot. 716 Cajon St is a home located in San Bernardino County with nearby schools including Kingsbury Elementary School, Cope Middle School, and Redlands Senior High School.
Ownership History
We collect this data history from publicly available records. To have your information removed, we recommend requesting removal directly through your county’s website.
Purchase Details
Purchase Details
Home Financials for this Owner
Home Financials are based on the most recent Mortgage that was taken out on this home.Home Values in the Area
Average Home Value in this Area
Purchase History
We collect this data history from publicly available records. To have your information removed, we recommend requesting removal directly through your county’s website.
| Date | Buyer | Sale Price | Title Company |
|---|---|---|---|
| -- | None Listed On Document | ||
| $170,000 | First American Title Ins Co |
Mortgage History
We collect this data history from publicly available records. To have your information removed, we recommend requesting removal directly through your county’s website.
| Date | Status | Borrower | Loan Amount |
|---|---|---|---|
| Previous Owner | $136,000 |
Tax History
We collect this data history from publicly available records. To have your information removed, we recommend requesting removal directly through your county’s website.
| Year | Tax Paid | Tax Assessment Tax Assessment Total Assessment is a certain percentage of the fair market value that is determined by local assessors to be the total taxable value of land and additions on the property. | Land | Improvement |
|---|---|---|---|---|
| 2025 | $3,750 | $300,138 | $74,756 | $225,382 |
| 2024 | $3,420 | $294,253 | $73,290 | $220,963 |
| 2023 | $3,414 | $288,483 | $71,853 | $216,630 |
| 2022 | $3,364 | $282,826 | $70,444 | $212,382 |
| 2021 | $3,423 | $277,281 | $69,063 | $208,218 |
| 2020 | $3,371 | $274,438 | $68,355 | $206,083 |
| 2019 | $3,276 | $269,057 | $67,015 | $202,042 |
| 2018 | $3,193 | $263,781 | $65,701 | $198,080 |
| 2017 | $3,164 | $258,609 | $64,413 | $194,196 |
| 2016 | $3,127 | $253,538 | $63,150 | $190,388 |
| 2015 | $3,103 | $249,729 | $62,201 | $187,528 |
| 2014 | $3,045 | $244,838 | $60,983 | $183,855 |
Map
- 618 Cypress Cir
- 18 W Cypress Ave
- 922 S Eureka St
- 233 Phlox Ave
- 924 Alvarado St
- 622 Esther Way
- 527 W Palm Ave
- 246 E Fern Ave Unit 205
- 254 E Fern Ave Unit 212
- 254 E Fern Ave Unit 107
- 0 Campbell Ave
- 400 Walnut Ave
- 302 Sonora St
- 234 Grant St
- 211 E Olive Ave
- 306 S Center St
- 116 Franklin Ave
- 1011 W Cypress Ave
- 120 Franklin Ave
- 1422 Henrietta St
Ask me questions while you tour the home.