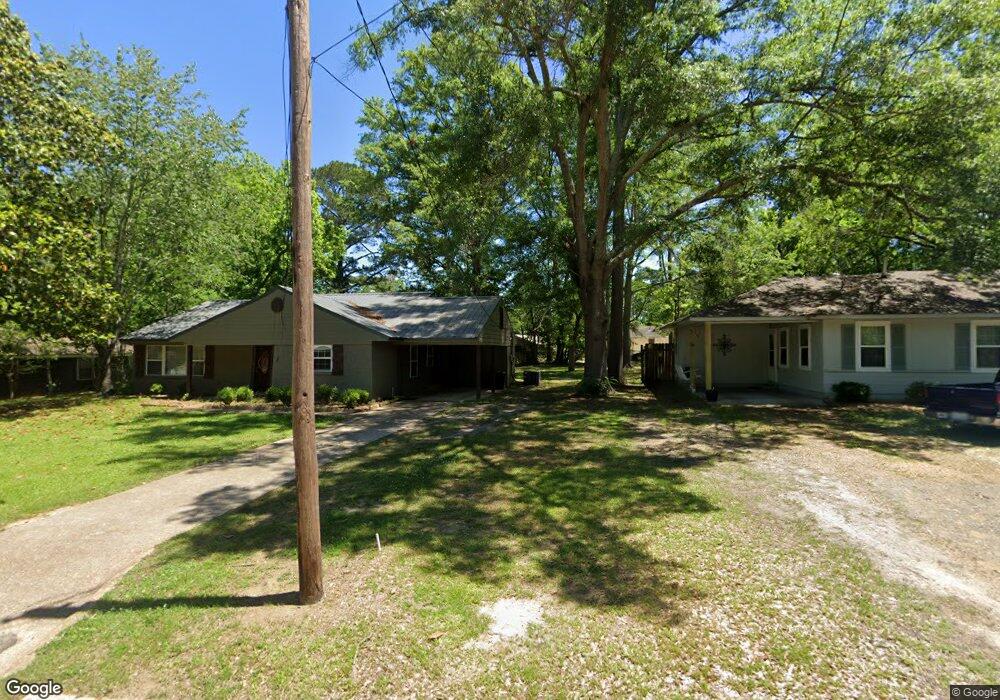
716 Calhoun St West Point, MS 39773
Estimated Value: $110,000 - $149,000
3
Beds
2
Baths
1,432
Sq Ft
$89/Sq Ft
Est. Value
About This Home
This home is located at 716 Calhoun St, West Point, MS 39773 and is currently estimated at $128,090, approximately $89 per square foot. 716 Calhoun St is a home located in Clay County with nearby schools including East Side Elementary School, West Clay Elementary School, and Church Hill Elementary School.
Ownership History
Date
Name
Owned For
Owner Type
Purchase Details
Closed on
Oct 11, 2017
Sold by
Mc & J Investments Llc
Bought by
Fields Bernessa
Current Estimated Value
Purchase Details
Closed on
Jan 3, 2014
Sold by
Secretary Of Housing And Urban Developme
Bought by
Bank Of America Na
Purchase Details
Closed on
Sep 15, 2005
Sold by
Eckel Peter K and Eckel Erin M
Bought by
Wofford Shirley
Home Financials for this Owner
Home Financials are based on the most recent Mortgage that was taken out on this home.
Original Mortgage
$46,273
Interest Rate
5.77%
Create a Home Valuation Report for This Property
The Home Valuation Report is an in-depth analysis detailing your home's value as well as a comparison with similar homes in the area
Purchase History
| Date | Buyer | Sale Price | Title Company |
|---|---|---|---|
| Fields Bernessa | -- | -- | |
| Bank Of America Na | -- | -- | |
| Wofford Shirley | -- | -- |
Source: Public Records
Mortgage History
| Date | Status | Borrower | Loan Amount |
|---|---|---|---|
| Previous Owner | Wofford Shirley | $46,273 |
Source: Public Records
Tax History
| Year | Tax Paid | Tax Assessment Tax Assessment Total Assessment is a certain percentage of the fair market value that is determined by local assessors to be the total taxable value of land and additions on the property. | Land | Improvement |
|---|---|---|---|---|
| 2025 | $364 | $9,479 | $1,303 | $8,176 |
| 2024 | $364 | $9,479 | $1,303 | $8,176 |
| 2023 | $865 | $7,785 | $1,303 | $6,482 |
| 2022 | $277 | $7,785 | $1,303 | $6,482 |
| 2021 | $276 | $7,785 | $1,303 | $6,482 |
| 2020 | $278 | $7,785 | $1,303 | $6,482 |
| 2019 | $247 | $7,725 | $1,303 | $6,422 |
| 2018 | $231 | $7,725 | $1,303 | $6,422 |
| 2017 | $491 | $9,965 | $2,138 | $7,827 |
| 2016 | $482 | $9,965 | $2,138 | $7,827 |
| 2015 | $456 | $9,137 | $2,138 | $6,999 |
| 2014 | -- | $9,137 | $2,138 | $6,999 |
| 2013 | -- | $9,137 | $2,138 | $6,999 |
Source: Public Records
Map
Nearby Homes
- 238 Calhoun St
- 74 Tom Bayne St
- 480 E Westbrook St
- 479 E Westbrook St
- 184 Tournament St
- 1046 E Brame Ave
- 551 E Westbrook St
- 98 Court St
- 33 Court
- 228 S Division St
- 228 Mccord St
- 15 David St
- 341 Mccord St
- 229 S Division St
- 507 S Eshman Ave
- 472 S Eshman Ave
- 26788 E Main St
- 26852 E Main St
- 44 Torbert Dr
- 26596 E Main St
Your Personal Tour Guide
Ask me questions while you tour the home.